FX Analysis - EUR and GBP rally on PMIs, USDJPY tests key level.
Lachlan Meakin
22/12/2023
•
0 min read
Share this post
Copy URL
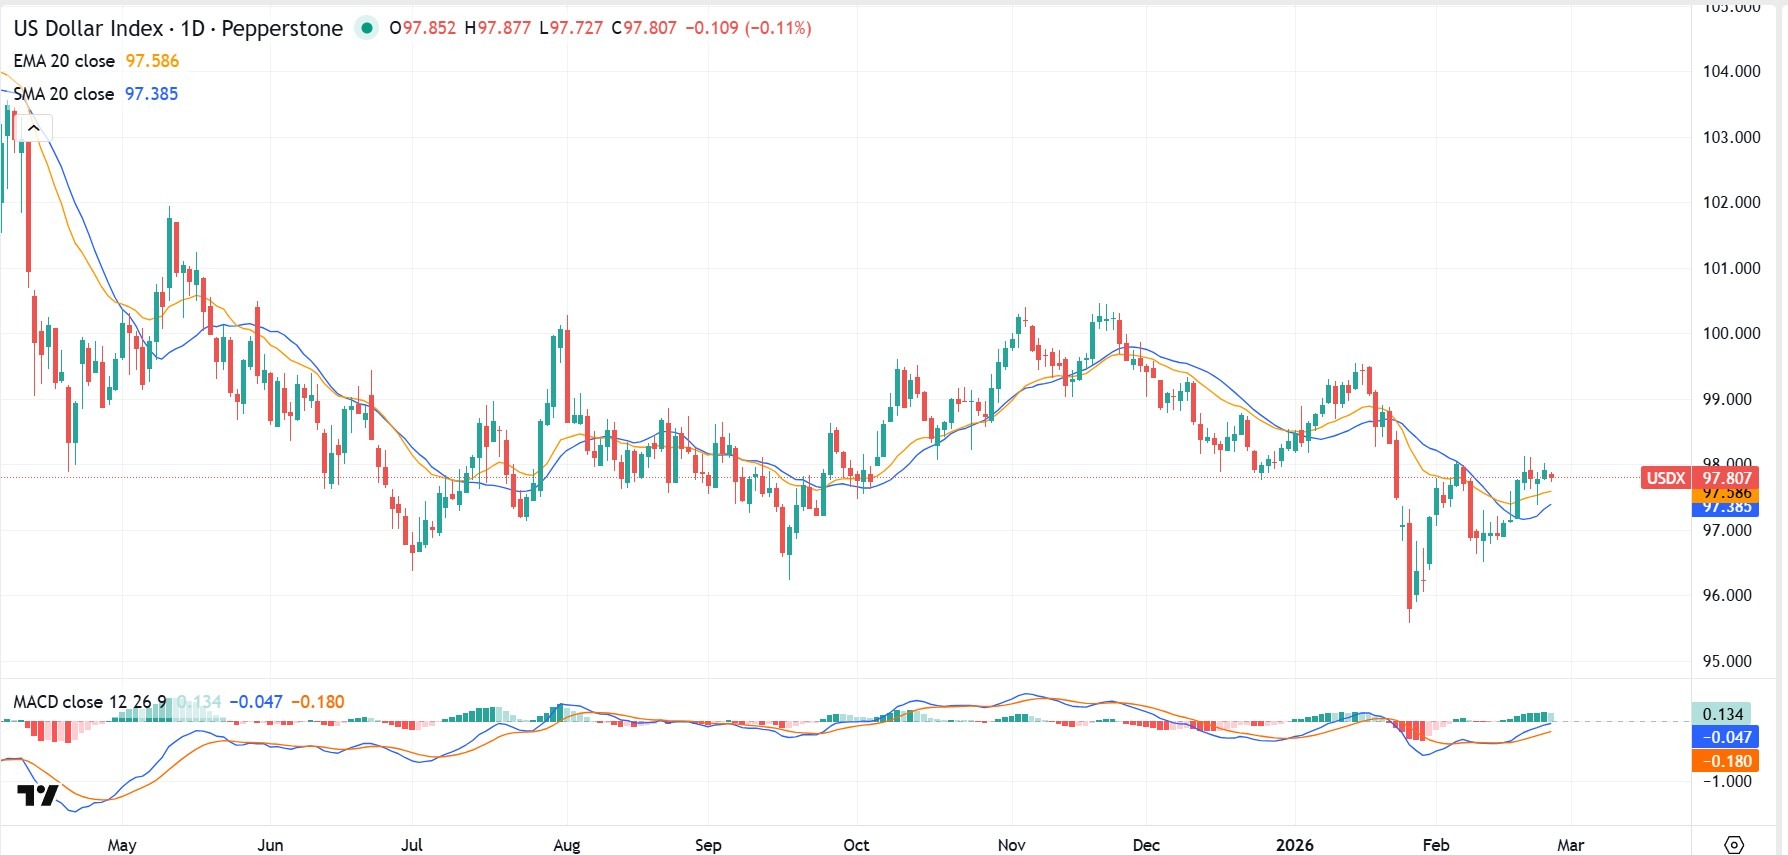
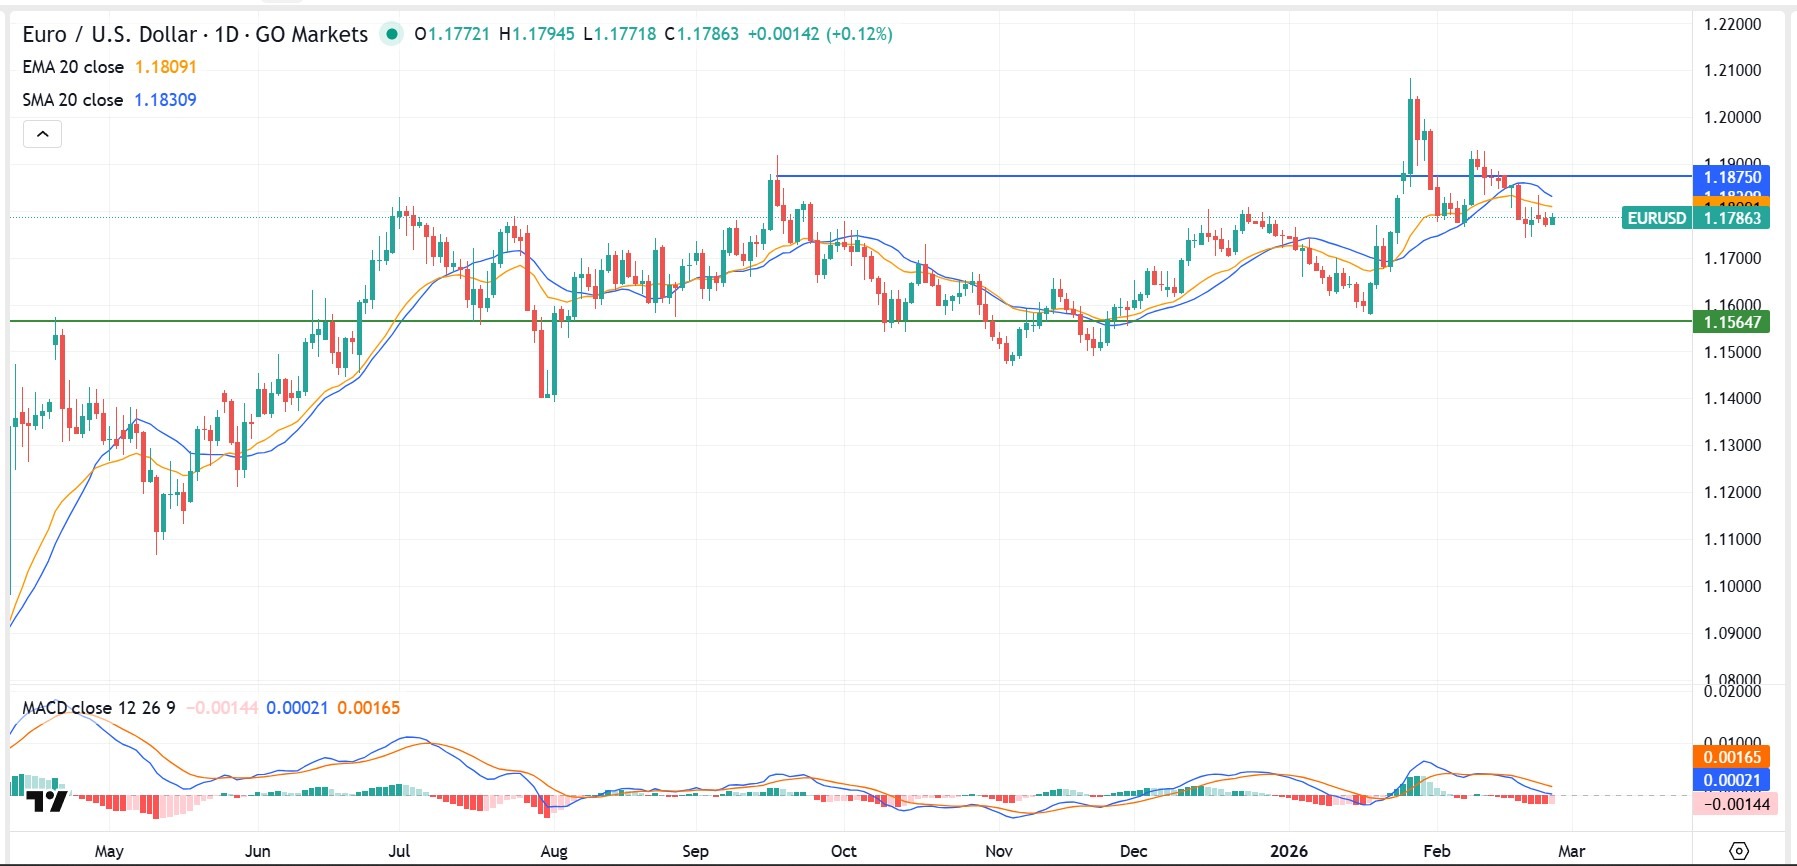
Markets were predictably quite due to holidays in the US and Japan on Thursday. USD was marginally softer overall with DXY dropping to test the support at the 200-day MA before recovering modestly amid the holiday lull for Thanksgiving. Source:TradingView.com EURUSD managed mild gains with price action choppy around the 1.0900 level but eventually managed to hold that key level.
There were several hawkish leaning comments from ECB officials and ECB Minutes noting that members argued in favour of keeping the door open for a possible further rate. Source:TradingView.com GBPUSD extended on its mid-week bounce and made further progress above 1.2500 after UK manufacturing and services PMI figures beat forecasts. Source:TradingView.com USDJPY ended flat for the session but not before a sharp dip reversed following a bounce off support at 149.00 and seeing the pair again settle above 149.50.
Source:TradingView.com Ahead on Fridays, US traders will be mostly offline meaning another likely low volume session, we do have Manufacturing and Services PMI figures out of the US later today though.
By
Lachlan Meakin
Head of Research, GO Markets Australia.
Disclaimer: Articles are from GO Markets analysts and contributors and are based on their independent analysis or personal experiences. Views, opinions or trading styles expressed are their own, and should not be taken as either representative of or shared by GO Markets. Advice, if any, is of a ‘general’ nature and not based on your personal objectives, financial situation or needs. Consider how appropriate the advice, if any, is to your objectives, financial situation and needs, before acting on the advice. If the advice relates to acquiring a particular financial product, you should obtain our Disclosure Statement (DS) and other legal documents available on our website for that product before making any decisions.
Start with what actually happened to FX markets in the lead-up to April: there was a geopolitical shock and oil supply out of the Middle East came under pressure. The immediate reaction across currency markets was the one traders have seen before: money moved toward safety, toward yield, and away from anything that looked exposed to the disruption.
Safe-haven flows meet yield divergence
The US dollar benefited from both of those forces at once. It is a safe haven and it also carries a yield advantage that most of its peers cannot match right now. The Swiss franc picked up some of the overflow from European risk aversion. The yen, which used to attract safe-haven flows almost automatically, is stuck in a different situation altogether where the yield gap against the dollar is now so wide that safe-haven logic has been overridden by carry logic.
The currencies that had the toughest month were the ones caught in the middle: risk-sensitive, commodity-linked, or running policy rates that simply cannot compete. The New Zealand dollar is the clearest example while the Australian dollar is a messier story. Sitting underneath all of it is a repricing of 2026 rate cut expectations that central banks in multiple countries are now reassessing.
DXY context
Regained 100 on geopolitical risk
Strongest currency
USD — safe haven plus yield
Weakest currency
NZD — yield gap plus energy
Main central bank theme
Repricing of 2026 rate cut paths
Main catalyst ahead
Fed and BOJ policy meetings
Monthly leaderboard — biggest movers
01USD
Rose sharply on safe-haven demand and higher for longer yield expectations.
Strong
02CHF
Advanced strongly as the preferred European refuge from Middle East risk.
Up
03JPY
Highly volatile; fell to 20-month lows before intervention commentary.
Volatile
04AUD
Mixed; caught between domestic energy inflation and a hawkish RBA.
Mixed
05NZD
Fell sharply; pressured by energy exposure and capital outflows.
Weak
Strongest mover: US dollar (USD)
The US dollar spent most of 2025 gradually losing ground as the Fed cut rates and the rest of the world played catch-up. That story stalled hard in late March. The Iran conflict changed the calculus, and the dollar reasserted itself in a way that reflects something real about its structural position in global markets.
The US exports oil and when energy prices rise, that is a terms-of-trade improvement, not a terms-of-trade shock. Most of the dollar's major peers sit on the other side of that equation. Add a policy rate range of 3.50% to 3.75% that now looks locked in for longer, and the dollar's advantage is both cyclical and structural at the same time. The US Dollar Index (DXY) has regained the 100 level but tThe question heading into April is whether it holds there or pushes further.
Key drivers
Safe-haven demand:
The Iran conflict directed flows into US assets across equities, Treasuries, and the dollar itself.
Yield advantage:
The federal funds rate at 3.50% to 3.75% provides a meaningful return floor relative to most peers, helping to sustain capital inflows.
Energy insulation:
The US position as an oil exporter creates a structural terms-of-trade benefit when oil prices rise sharply.
Rate cut repricing:
Market expectations for 2026 Fed cuts have been scaled back significantly, removing a key source of dollar headwinds.
What markets are watching next
The DXY's ability to hold above 100 is the near-term reference point. The 10 April CPI print is the most direct test. A reading above expectations may add further support, while a soft print could give traders reason to take some dollar positions off the table.
The main risks to the upside case are a sudden diplomatic resolution in the Middle East, which could reduce safe-haven demand quickly, or a labour market print on 3 April that is weak enough to revive recession concerns and push rate cut expectations higher again.
Weakest mover: New Zealand dollar (NZD)
If you wanted to design a currency that would struggle in the current environment, the NZD fits the brief almost perfectly. It is risk-sensitive. It is commodity-linked. It runs a policy rate of 2.25%, which sits below the Fed and now below the RBA as well. New Zealand is also an energy importer, so rising oil prices hit the trade balance and the domestic inflation outlook at the same time.
None of those things are new but the combination of all of them hitting at once, against a backdrop of a surging dollar and broad risk-off sentiment, has compressed the NZD in a way that is hard to ignore. The carry trade that once made NZD attractive has reversed as capital has been moving out, not in.
Key drivers
Energy import exposure:
Rising Brent crude hits New Zealand's trade balance directly and adds upside pressure to domestic inflation.
Yield gap:
The 2.25% Reserve Bank of New Zealand (RBNZ) policy rate sits below the Fed and the RBA, sustaining negative carry against both the USD and AUD.
Risk-off positioning:
As a commodity and risk currency, the NZD tends to underperform when global sentiment deteriorates.
Trade uncertainty:
Ongoing tariff related uncertainty continues to weigh on export sector confidence.
Risks and constraints
Any unexpected hawkish commentary from the RBNZ or a sharp decline in oil prices could provide some relief. A broader improvement in global risk appetite would also tend to benefit the NZD, given its sensitivity to sentiment shifts.
But the structural yield disadvantage is not going away quickly, and that may continue to limit the pair's recovery potential.
USD/JPY
USD/JPY is the pair that most clearly illustrates what happens when a currency's safe-haven status gets overridden by carry logic. The yen used to be the first port of call for traders looking for protection during geopolitical stress. That dynamic has been suppressed, and the reason is straightforward: you give up too much yield to hold yen right now.
The Bank of Japan (BOJ) policy rate sits at 0.75% while the Fed's sits at 3.50% to 3.75% and that gap does not encourage safe-haven flows. It encourages borrowing in yen and deploying elsewhere. So while the dollar rose on geopolitical risk, the yen fell on the same event. That is not how it is supposed to work, but it is how the maths works out when yield differentials are this wide.
USD/JPY is sitting near 159, which leaves it not far from the 160 level that Japan's Ministry of Finance has consistently flagged as a line requiring attention. The BOJ meeting on 27 and 28 April is now a genuinely live event.
Key events to watch
Tokyo CPI, 30 March (AEDT):
March inflation data. A strong read may build the case for BOJ action at the April meeting.
BOJ meeting, 27 and 28 April (AEST):
Markets are treating this as a live event. The quarterly outlook report may include updated inflation forecasts that shift rate hike timing expectations.
Intervention watch:
Japan's Ministry of Finance has been explicit about the 160 level. Actual intervention, or a credible threat of it, could trigger a sharp and fast reversal.
What could shift the outlook
A hawkish BOJ, actual FX intervention, or a softer US CPI print that reduces dollar support could all push USD/JPY lower from current levels. On the other side, a dovish hold from the BOJ combined with continued dollar strength could see the pair test 160 and potentially beyond, which would likely intensify the intervention conversation in Tokyo.
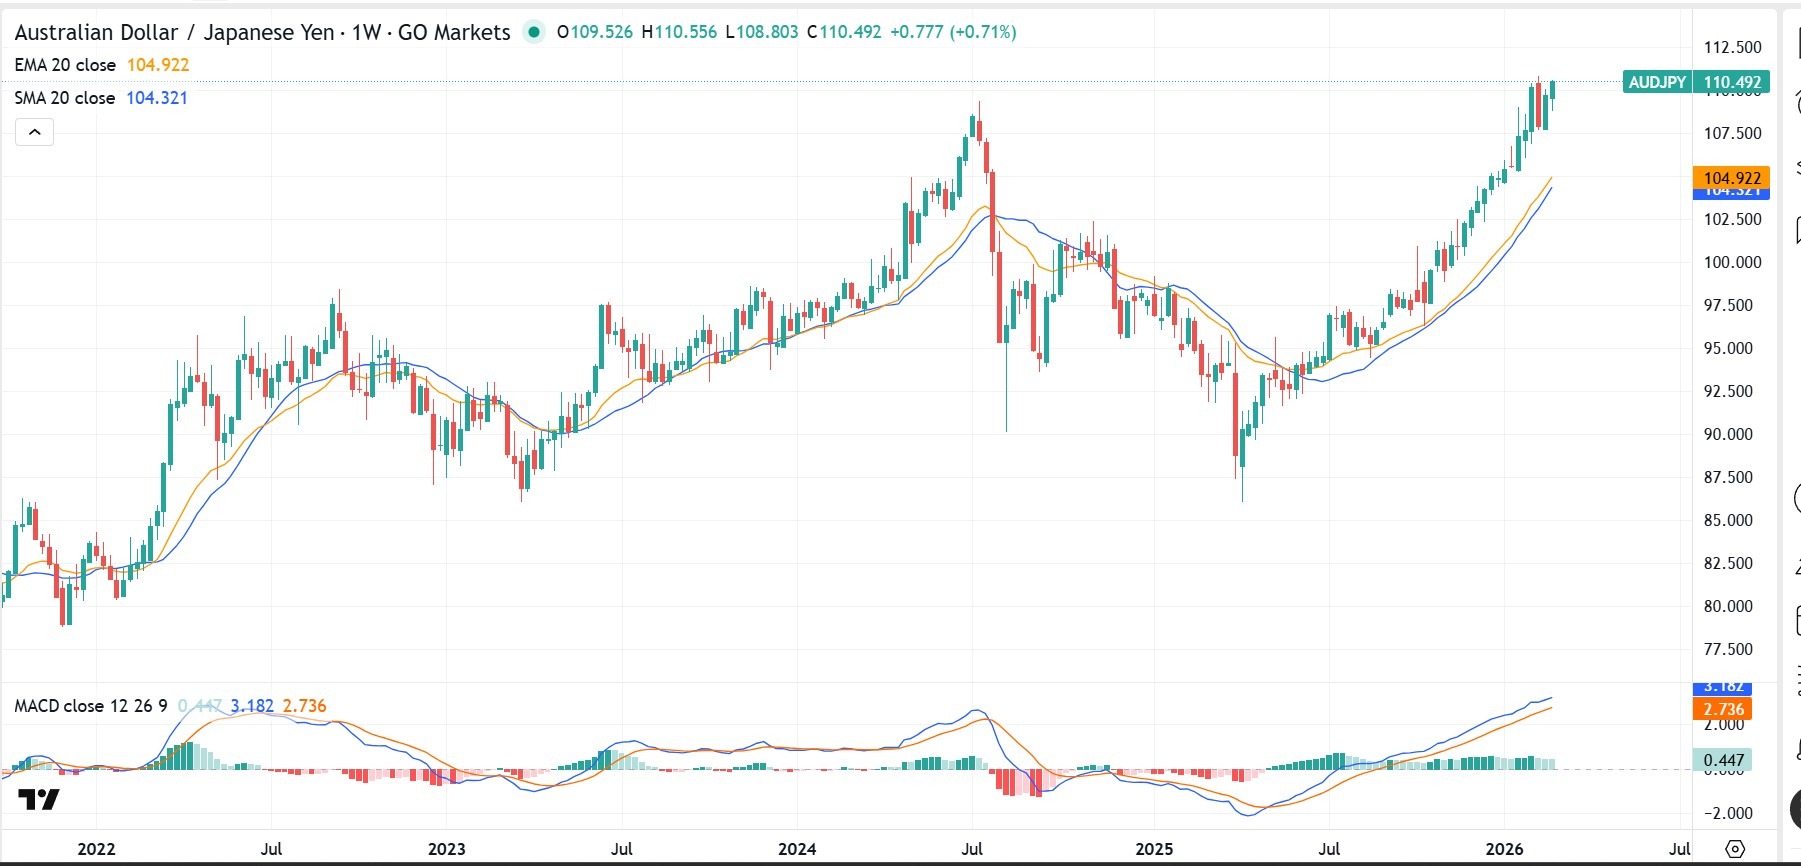
For traders watching AUD/JPY and other yen crosses, the BOJ meeting on 27 and 28 April carries similar weight. A hawkish shift tends to compress yen crosses broadly, not just USD/JPY.
Data to watch next
Four events stand out as the clearest potential FX catalysts in the weeks ahead. Each has a direct transmission channel into rate expectations, and rate expectations are driving much of the move in FX right now.
Key dates and FX sensitivity
30
Mar
Tokyo CPI
JPY pairs, USD/JPY · AEDT
A strong read may strengthen the case for a more hawkish BOJ at the April meeting.
3
Apr
US labour market (NFP)
USD pairs, AUD/USD, NZD/USD · 10:30 pm AEDT
A weak result could revive recession concerns and alter Fed pricing.
10
Apr
US CPI - March
USD/JPY, EUR/USD, gold · 10:30 pm AEST
The most direct test of whether inflation is easing fast enough to reopen the rate cut conversation.
27-28
Apr
BOJ meeting and quarterly outlook report
JPY crosses, AUD/JPY · AEST
The key policy event for yen crosses. Updated inflation forecasts may shift rate hike timing expectations.
Key levels and signals
These are the reference points that traders and policymakers are watching most closely. Each one represents a potential trigger for a shift in positioning or an official response.
◆
DXY 100.00
A psychologically and technically significant support level. Holding above it may sustain the dollar's current run across major pairs. A break below it would likely signal a broader sentiment shift.
◆
USD/JPY 160.00
Japan's Ministry of Finance has consistently referenced this level as a threshold requiring attention. Actual intervention, or a credible threat of it, has historically been capable of producing sharp and fast reversals in the pair.
◆
Brent crude US$120
A move to this level would likely intensify risk off behaviour across FX markets, putting further pressure on energy importing currencies including the NZD, EUR, and JPY.
◆
AUD/USD 0.7000
This level has historically attracted buying interest and may act as a near term directional reference for positioning in the pair.
Bottom line
The FX moves heading into April were shaped by a combination of geopolitical shock, yield divergence, and a repricing of central bank expectations that few had positioned for at the start of the quarter. The dollar's dual role as a high yielding and safe haven currency has put it in an unusually strong position, but that position is not unconditional.
One soft CPI print, one diplomatic breakthrough, or one labour market miss could change the tone quickly. Currency moves may remain highly data dependent and sensitive to overnight news flow from the Middle East, where developments can gap markets before the next session opens.
Access a broader FX universe and stay flexible as conditions change. Open an account · Log in
March’s foreign exchange (FX) markets could be shaped by several high-impact releases clustered around the first half of the month. China PMIs, Australia GDP, Japan GDP and the Federal Reserve’s March meeting could all influence FX sentiment as the month progresses.
Quick facts
US rate expectations remain stable, with CME FedWatch implying a greater than 85% probability of no rate change at the March FOMC meeting.
China PMIs, CPI/PPI and trade data will help shape early-month regional risk tone.
Australia's GDP, RBA decision, labour force data and CPI create a concentrated domestic event window for AUD.
Japan GDP and the Bank of Japan (BoJ) policy meeting may influence domestic yield repricing and JPY volatility.
Euro area CPI, industrial production and the ECB Monetary Policy Decision remain key for EUR stability.
US dollar (USD)
Key events
Nonfarm Payrolls: 12:30 am, 7 March (AEDT)
Consumer Price Index (CPI): 11:30 pm, 11 March (AEDT)
Retail Sales: 11:30 pm, 17 March (AEDT)
Federal Reserve policy decision: 5:00 am, 19 March (AEDT)
Federal Reserve press conference: 5:30 am, 19 March (AEDT)
What to watch
The USD remains primarily driven by inflation and labour data and their implications for Federal Reserve pricing.
CME FedWatch pricing indicates that markets are assigning a greater than 85% probability of no rate change at the March FOMC meeting. This suggests positioning is currently anchored around a pause, increasing sensitivity to any inflation surprise that could shift expectations.
With a pause largely priced in, USD direction may hinge more on inflation trajectory and longer-term policy expectations than the decision itself. Firmer CPI or resilient labour data could reinforce yield support.
Euro area CPI (flash estimate): 10:00 pm, 3 March (AEDT)
Euro area industrial production: 9:00 pm, 13 March (AEDT)
ECB Monetary Policy Decision: 12:15 am, 20 March (AEDT)
ECB press conference: 12:45 am, 20 March (AEDT)
Eurozone flash PMI: 8:00 pm, 24 March (AEDT)
What to watch
EUR direction remains linked to inflation persistence and whether growth data stabilise expectations around ECB policy.
Sticky inflation or improved activity data could limit easing expectations and support the EUR. Softer inflation and weaker production data may renew downside pressure, particularly if US data remain firm.
EUR/USD daily structure shows consolidation following an upside extension earlier in the year. Short-term momentum has moderated, with price holding above longer-term support levels.
Japan GDP (Q4 2025, 2nd estimate): 10:50 am, 10 March (AEDT)
Bank of Japan policy meeting: 18–19 March (AEDT)
BOJ statement on monetary policy: 19 March (AEDT)
What to watch
JPY remains sensitive to domestic growth data and Bank of Japan policy decisions. Yield expectations and policy normalisation signals continue to influence USD/JPY and cross-JPY volatility.
The BOJ policy meeting and subsequent communication may influence short-term volatility and longer-term rate expectations, and by extension JPY sentiment.
Stronger GDP or policy signals reinforcing normalisation could support JPY via domestic yield adjustments. More cautious messaging may maintain yield differentials in favour of USD and AUD.
RBA Monetary Policy Decision: 2:30 pm, 17 March (AEDT)
Labour Force Survey: 11:30 am, 19 March (AEDT)
Consumer Price Index (CPI): 11:30 am, 25 March (AEDT)
What to watch
AUD faces a domestic calendar centred around the 16–17 March RBA meeting. Growth, labour and inflation releases cluster within a three-week window, increasing the potential for volatility.
Stronger GDP or persistent inflation could reinforce policy caution and support AUD. Softer labour or CPI outcomes may weigh on rate expectations and pressure AUD, particularly against USD and JPY.
Chinese data early in the month may also influence regional sentiment and commodity-linked currencies such as AUD.
April's US earnings season is landing in a market that wants more than a good story. JPMorgan has already set a high bar with a strong result, and attention is now shifting to the engine room of the S&P 500: AI infrastructure. Three companies are at the centre of that story.
Why this earnings window matters for AI
Microsoft, Alphabet and NVIDIA are not just participants in the AI cycle, they are building the physical and software architecture that other companies depend on: the chips, the cloud regions, the models and the tools. If this spending is going to deliver returns, the first signs may start to show in their quarterly results over the next few weeks.
Each company represents a different test.
Microsoft: Whether enterprise AI adoption is translating into revenue and margin expansion
Alphabet: Whether owning the full stack, from chips to cloud to distribution, is a durable advantage or simply an expensive position to defend
NVIDIA: Whether the hardware cycle is still holding, accelerating or starting to level out
In 2026, the question is no longer whether AI investment is happening, the capital commitments are substantial and already publicly stated. The question is whether that spending is generating returns quickly enough to justify the scale of those bets.
IMPORTANT: REPORTING SCHEDULES CAN CHANGE WITHOUT NOTICE. REPORTING DATES AND RELEASE TIMES ARE FROM COMPANY INVESTOR RELATIONS CALENDARS WHERE MARKED CONFIRMED; OTHERWISE THEY ARE GO MARKETS ESTIMATES. CONSENSUS EPS, REVENUE AND ANALYST-RANGE DATA ARE FROM THIRD-PARTY MARKET CONSENSUS SOURCES, AS OF 16 APRIL 2026 (AEST). COMPANY GUIDANCE, BACKLOG AND OPERATING METRICS ARE FROM THE LATEST COMPANY FILINGS OR RESULTS PRESENTATIONS UNLESS STATED OTHERWISE. FIGURES AND SCHEDULES MAY CHANGE WITHOUT NOTICE.
$MSFT| Q1 2026 REPORTING PERIOD
Microsoft Corporation
NASDAQ | Technology | 29 Apr 2026
Confirmed
Global Release Countdown (AMC)
00:00:00:00
Consensus EPS
US$4.04
Consensus Revenue
US$81.40bn
AU/ASIA30 Apr | 6:05 am
US/LATAM29 Apr | 4:05 pm
Market Intelligence: $MSFT
Analysis: Microsoft price drivers and scenarios
Azure Growth Target
37-38%
Constant currency projection
AI Contribution
+6-8 pts
Azure revenue from AI services
FY26 Capex
US$146bn
Total infrastructure spending
AVG
LOW US$3.86AVG US$4.04HIGH US$4.14
Microsoft is being tested on a specific question: can it turn heavy AI spending into margin expansion? A result above US$4.14 could ease concerns over "capex fatigue" and demonstrate whether Azure growth is re-accelerating alongside enterprise AI adoption.
Factors that could move the markets
Azure growth rate
Watch if constant-currency growth re-accelerates above 39%, suggesting AI workloads are filling new capacity rather than sitting idle.
Signal: Capacity Utilisation
Workplace agent adoption
The shift to autonomous agents is central. Clear enterprise uptake in Dynamics 365 supports the high-tier subscription thesis.
Signal: Software Monetisation
Maia 200 cost savings
If the in-house AI chip is lowering inference costs at production levels, gross margins may start to recover from recent compression.
Watch: Gross Margin Recovery
Regulatory backdrop
Ongoing scrutiny of cloud bundling practices remains a potential headwind; management commentary here is vital for the long-term view.
Watch: Bundling Compliance
Sentiment Analysis · Microsoft Corp.
Interactive scenario analysis: $MSFT
Select earnings outcome
AI Scaling Proof
Strong result, backed by real AI progress
EPS above US$4.14 and Azure re-acceleration above 39% could support the view that AI spending is starting to translate into commercial returns. Workplace Agents show measurable ROI and FY26 guidance is raised.
EPS Outcome
Above US$4.14
Cloud Signal
Accelerating
Guidance
Raised
Possible reaction
Strong rally
Sources & Data Methodology
Sources: Reporting dates and release times are from company investor relations calendars where marked Confirmed; otherwise they are GO Markets estimates. Consensus EPS, revenue and analyst-range data are sourced from Bloomberg and Earnings Whispers, as at 16 April 2026 (AEST). Company guidance, backlog and operating metrics are sourced from the latest company filings or results presentations. Any scenario analysis reflects GO Markets analysis. Figures and schedules may change without notice.
Expanded Coverage
Beyond the Chipmakers
As the "show me the money" year unfolds, discover how AI demand is impacting Tesla, NextEra, and Exxon.
Alphabet has transformed from a search business into a sprawling AI infrastructure play, and this result will test whether that transformation is delivering. The US$185 billion capex forecast for 2026 is extraordinary, close to double last year's spending. EPS is expected to decline slightly year on year, precisely because that infrastructure spending is consuming capital. The question is whether Google Cloud's growth is fast enough to show a credible path back to margin recovery, and whether Ironwood, the seventh-generation custom AI chip, is proving its cost-per-query advantage at scale.
$GOOGL| Q1 2026 REPORTING PERIOD
Alphabet Inc.
NASDAQ | Technology | 29 Apr 2026
Confirmed
Global Release Countdown (AMC)
00:00:00:00
Consensus EPS
US$2.64
Consensus Revenue
US$92.14bn
AU/ASIA30 Apr | 6:30 am
US/LATAM29 Apr | 4:30 pm
Market Intelligence: $GOOGL
Analysis: Alphabet price drivers and scenarios
Cloud growth
48% YoY
Compared with last quarter
Ironwood TPU
10x peak
Vs previous-generation chip
2026 Capex
US$185bn
Double last year's spending
AVG
LOW US$2.50AVG US$2.64HIGH US$2.80
Alphabet has shifted to being viewed as a broader AI infrastructure play. The question is whether Cloud growth can support a path back to margin recovery while the massive US$185bn infrastructure buildout absorbs capital.
Factors that could move the markets
Google Cloud momentum
Markets are watching if the 48% growth rate holds, specifically among customers using Ironwood TPUs for large-scale AI.
Signal: Enterprise AI Adoption
Search & AI overview
If compute-intensive AI summaries are monetising through ads, it supports core search economics in the AI era.
Focus: Search Economics
Capex & margin trajectory
With free cash flow under pressure from US$185bn capex, markets want to know when infrastructure investment will moderate.
Watch: Spending Ceiling
DOJ antitrust risk
Management commentary on the legal timeline for Chrome or Android divestiture appeals will influence how risk is priced.
Watch: Regulatory Remedies
Sentiment Analysis · Alphabet Inc.
Interactive scenario analysis: $GOOGL
Select earnings outcome
Efficiency Proof
Ironwood efficiency drives upside
EPS above US$2.80 and cloud growth above 45% suggest Ironwood is cutting costs and strengthening Google’s advantage faster than expected.
EPS outcome
Above US$2.80
Cloud Signal
Strong growth
Waymo
Accelerating
Reaction
Sentiment improves
Sources & Data Methodology
Sources: Reporting dates and release times are from company investor relations calendars where marked Confirmed; otherwise they are GO Markets estimates. Consensus EPS, revenue and analyst-range data are sourced from Bloomberg and Earnings Whispers, as at 16 April 2026 (AEST). Company guidance, backlog and operating metrics are sourced from the latest company filings or results presentations. Any scenario analysis reflects GO Markets analysis. Figures and schedules may change without notice.
NVIDIA: the hardware cycle read through
NVIDIA is no longer simply a chip company. It has become what analysts now describe as the central bank of compute, the entity whose product determines how much AI capacity the world can actually deploy.
The upcoming Q1 FY2027 result will test whether the new Vera Rubin R100 GPU architecture, which entered mass production ahead of schedule, is already contributing to revenue, and whether NVIDIA can sustain gross margins above 75% as inference, rather than training, becomes the dominant workload. Inference is more competitive and more price-sensitive than training, so margin resilience here matters.
$NVDA| Q1 2026 REPORTING PERIOD
NVIDIA Corporation
NASDAQ | Semiconductors | 20 May 2026
Confirmed
Global Release Countdown (AMC)
00:00:00:00
Consensus EPS
US$1.70
Consensus Revenue
US$78.42bn
AU/ASIA21 May | 6:30 am
US/LATAM20 May | 4:30 pm
Market Intelligence: $NVDA
Analysis: NVIDIA price drivers and scenarios
Revenue growth
73% YoY
Last quarter benchmark
Data centre share
91%+
Share of total revenue
Rubin R100
In production
Mass production began April 2026
AVG
LOW US$76bnAVG US$78bnHIGH US$81bn+
NVIDIA’s outlook depends on whether Rubin R100 can keep gross margins above 75% as inference becomes a bigger part of demand. Because inference is more price-sensitive than training, margins are the key test.
Factors that could move the markets
Rubin ramp-up
Watch whether Rubin production can scale smoothly without disrupting the Blackwell transition.
Signal: supply chain continuity
Inference margins
The key test is whether NVIDIA can keep gross margins above 75% as inference revenue grows.
Signal: pricing power holds up
Sovereign AI demand
Government-backed investment in Europe and the Middle East could broaden the base beyond hyperscalers.
Signal: market expansion
CUDA regulatory risk
Any US or European scrutiny of NVIDIA’s software advantage could move the stock regardless of the revenue result.
Signal: software moat under review
Sentiment Analysis · NVIDIA Corp.
Interactive scenario analysis: $NVDA
Select earnings outcome
Rubin ramp supports growth
Rubin ramp supports growth
Revenue above US$81 billion may suggest the Rubin ramp is tracking ahead of expectations. That could support the view that AI demand is broadening into sovereign AI and enterprise markets, helping extend visibility into 2027.
Revenue Outcome
Above US$81bn
Gross Margin
Above 75%
Workload
Inference strong
Reaction
Positive read-through
Sources & Data Methodology
Sources: Reporting dates and release times are from company investor relations calendars where marked Confirmed; otherwise they are GO Markets estimates. Consensus EPS, revenue and analyst-range data are sourced from Bloomberg and Earnings Whispers, as at 16 April 2026 (AEST). Company guidance, backlog and operating metrics are sourced from the latest company filings or results presentations. Any scenario analysis reflects GO Markets analysis. Figures and schedules may change without notice.
Why this reporting window matters for the broader market
Microsoft and Alphabet report on the same evening, 29 April, making the overnight session into 30 April one of the most information-dense points of the year for equity markets. For Australian traders, both results should be available by 6:30 am AEST on Thursday 30 April. That means price reactions may already be visible in US futures before the ASX opens.
NVIDIA reports later, in May, but it casts a long shadow over everything in between. The guidance the company gave for Q1 FY2027, US$78 billion in revenue, has set a benchmark the market has been tracking for months. If Microsoft and Alphabet's results suggest AI infrastructure demand has softened, that could reset expectations heading into NVIDIA's call. If both beat expectations and signal accelerating cloud growth, that could lift the floor for what NVIDIA may report.
That interconnection is what makes this cluster different from most earnings windows. The results do not just affect the individual companies. They also signal the health of an investment supercycle that has driven global equity market leadership for the past two years.
What could shift the picture
Three risks could change the narrative regardless of how the numbers print. Each one is worth understanding before the results land.
1
Capex fatigue
If both Microsoft and Alphabet report in line or below expectations while reaffirming enormous spending plans, the market may start pricing the risk that AI monetisation is slower than the spending implies. That is not a stock-specific concern. It would be a broader de-rating event, affecting the valuations of companies across the technology sector that are priced on the assumption that AI returns are coming and coming soon.
2
Regulatory escalation
The FTC investigation into Microsoft, the DOJ case against Alphabet, and emerging EU scrutiny of NVIDIA's CUDA software ecosystem are all active. A material legal development before the earnings calls, whether a new filing, a remedy announcement or a court ruling, could overshadow the financial results entirely. Regulatory risk in this sector is not theoretical. It is live and moving.
3
Competition from custom silicon
Microsoft's Maia 200 chip, Alphabet's Ironwood TPU, Amazon's Trainium and Meta's custom accelerators are all reducing how much the large cloud companies depend on NVIDIA hardware. If any of these companies signals a meaningful shift in its GPU procurement plans during the earnings call, that could create uncertainty around NVIDIA's forward order book, even if its own Q1 FY2027 results beat expectations.
The 2026 Reality Check
$MSFT
AI spend is shifting from cost to competitive advantage. The question is whether margins can follow.
$GOOGL
Vertical integration from chips to search to cloud may prove to be a moat, or an expensive position to defend.
$NVDA
This is the pulse of the AI hardware cycle, and a test of whether Rubin can keep the supercycle alive into 2027.
Bottom Line
Microsoft and Alphabet report on the same evening, 29 April. NVIDIA follows in late May. Together, they may offer the clearest read yet on whether the AI infrastructure buildout is generating returns fast enough to justify the extraordinary scale of capital being committed. The earnings per share (EPS) number is important. What management says about AI monetisation timelines, capex trajectories and competitive positioning may matter more.
Your next earnings setup starts here
Stay ahead of major beats, misses, and market surprises. Log in to your terminal, open a new account, or explore our dedicated earnings academy.
April’s US earnings season is landing in a market that wants more than a good story. As GO Markets highlighted in its recent defence earnings watchlist, this reporting period is arriving after a broader shift in what markets care about. It is no longer just about growth at any cost. Traders want to know what the numbers are saying beneath the surface.
Why these 3 names matter
In this part of the market, that brings Tesla, NextEra Energy and Exxon Mobil into focus. Each offers a different read on a key 2026 theme: autonomy, electricity demand and oil supply risk.
Tesla: Is being judged on whether autonomy and energy can support the next stage of growth
NextEra: Offers a window into rising power demand and the infrastructure needed to meet it
Exxon Mobil: Sits at the centre of the oil and energy security story as supply risks stay in focus
Taken together, these three names help explain where attention may be shifting. The question is no longer just who has the strongest narrative, rather, who can show real demand, firmer margins and execution that holds up in a more complicated backdrop.
In 2026, AI power demand is pushing utilities, storage and grid capacity into sharper focus while at the same time, oil supply risk has brought energy security back into the market conversation.
IMPORTANT: REPORTING SCHEDULES CAN CHANGE WITHOUT NOTICE. REPORTING DATES AND RELEASE TIMES ARE FROM COMPANY INVESTOR RELATIONS CALENDARS WHERE MARKED CONFIRMED; OTHERWISE THEY ARE GO MARKETS ESTIMATES. CONSENSUS EPS, REVENUE AND ANALYST-RANGE DATA ARE FROM THIRD-PARTY MARKET CONSENSUS SOURCES, AS OF 14 APRIL 2026 (AEST). COMPANY GUIDANCE, BACKLOG AND OPERATING METRICS ARE FROM THE LATEST COMPANY FILINGS OR RESULTS PRESENTATIONS UNLESS STATED OTHERWISE. FIGURES AND SCHEDULES MAY CHANGE WITHOUT NOTICE.
$TSLA| Q1 2026 REPORTING PERIOD
Tesla Inc.
NASDAQ | Consumer Discretionary | 22 Apr 2026
Confirmed
Global Release Countdown (AMC)
00:00:00:00
Consensus EPS
US$0.41
Consensus Revenue
US$22.26bn
AU/ASIA23 Apr | 6:05 am
US/LATAM22 Apr | 4:05 pm
Market Intelligence: $TSLA
Analysis: Tesla price drivers and scenarios
Auto Gross Margin
17-19%
Target floor, excl. credits
Megapack Growth
+25% YoY
Projected energy deployment
Analyst range
US$0.32-0.48
EPS estimate range
AVG
LOW US$0.32AVG US$0.41HIGH US$0.48
The US$0.16 analyst range shows there is still a lot of uncertainty. The main question is how weaker vehicle deliveries compare with stronger, higher-margin energy storage contributions. A result above US$0.48 would suggest the autonomy and battery story is improving faster than the bear case expects.
Key factors that could move the result
Automotive gross margin
This is the most important number for Tesla’s core business. Markets want to see whether price cuts have started to settle, or whether margins are still under pressure.
Benchmark: 17% (excluding credits)
Energy storage (Megapacks)
This is the more durable growth story. Strong Megapack deployment and battery margins could help offset weaker vehicle deliveries
Focus: Storage growth versus pressure in the auto business
Full Self-Driving (FSD) & Robotaxi
This is the main narrative driver. Markets will watch for updates on FSD adoption and the robotaxi timeline to judge whether the move towards “physical AI” is becoming more credible.
Watch: Timing for next-generation autonomy technology
Regulatory credits
This is a quality check on the result. If EPS is boosted too much by credit sales, some traders may see the beat as less durable.
Watch: How much credit sales contribute to final EPS
Trade Execution: $TSLA
Earnings reaction framework: Q1 2026
Bull case
EPS above US$0.45, energy margins at 20%+ | FSD take rates rising
The result clears the top-tier analyst range. Commentary focuses on FSD scaling and Megapack production ramps rather than vehicle discounting. FY26 guidance is reaffirmed.
Possible reaction: stronger momentum, with short covering adding support
Base case
EPS between US$0.38 and US$0.43, auto margins stable | Near target
The result is close to expectations, but there is no major surprise from the energy business. The market stays focused on the robotaxi timeline. The initial move may be limited if the product mix looks unchanged.
Possible reaction: range-bound trading or a muted early response
Bear case
EPS below US$0.35, auto margins drop below 16% | Signs of FSD delays
The result misses even cautious expectations. Rising inventory suggests more discounting may be needed. The market starts to question whether the level of spending on AI and autonomy is too high.
Possible reaction: rotation out of the stock, especially if growth confidence weakens
Sentiment Analysis · Tesla Inc.
Interactive scenario analysis: $TSLA
Select earnings outcome
Growth momentum
Strong result, helped by energy and FSD
FSD and Energy do better than expected, which helps offset weaker car deliveries. Management gives the market more confidence that autonomy is getting closer to real revenue. Auto margins staying above 17% would also help.
EPS Outcome
Above US$0.45
Energy Signal
On track
Margins
At or above 17%
Possible reaction
Strong rally
Sources & Data Methodology
Sources: Reporting dates and release times are from company investor relations calendars where marked Confirmed; otherwise they are GO Markets estimates. Consensus EPS, revenue and analyst-range data are sourced from Bloomberg and Earnings Whispers, as at 14 April 2026 (AEDT). Company guidance, backlog and operating metrics are sourced from the latest company filings, results presentations or investor relations materials unless stated otherwise. Any scenario analysis reflects GO Markets analysis. Figures and schedules may change without notice.
Expanded Coverage
AI isn’t the only trade this earnings season.
From data centres to defence, see why JPMorgan and the big defence players are on our radar for March.
If Tesla is the market’s test of whether physical AI can become a business, NextEra is a test of whether the power buildout behind AI is starting to show up more clearly in utility economics.
That is what makes the shift from Tesla to NextEra interesting: one is about ambition and platform narrative and the other is about power, contracts, infrastructure and return on capital.
$NEE| Q1 2026 REPORTING PERIOD
NextEra Energy, Inc.
NYSE | Utilities | 23 Apr 2026
Confirmed
Global Release Countdown (BMO)
00:00:00:00
Consensus EPS
US$0.91
Consensus Revenue
US$7.17bn
AU/ASIA23 Apr | 9:35 pm
US/LATAM23 Apr | 7:35 am
Market Intelligence: $NEE
Analysis: NEE price drivers and scenarios
Backlog
About 29.8 GW
Total Energy Resources backlog
Growth target
8%+ a year
Adjusted EPS growth through 2032
Analyst range
US$0.88-1.06
Q1 EPS estimate range
AVG
LOW US$0.88AVG US$0.92HIGH US$1.06
The main question is simple: can NextEra turn big growth plans into real progress? Traders want to see whether rising power demand, especially from AI, is starting to show up in results, contracts and project execution.
Trade Execution: $NEE
Key signals to watch
Contract conversion
One of the biggest proof points. Markets want to see whether strong customer interest is turning into signed agreements and clearer revenue visibility.
Signal: More large-load agreements signed
Natural gas and power buildout
Traders will watch for clearer milestones on the approved gas buildout and capacity plan to meet rising power demand.
Focus: Buildout timeline and project execution
Funding and capital discipline
Investors will want to know whether funding plans look manageable after the recent equity raise and the impact of financing costs.
Watch: Funding risk and capital pressure
Rate base and earnings outlook
Markets look for healthy rate-base growth and signs that rising demand can support long-term earnings growth.
Focus: Guidance, rate-base growth and EPS visibility
Sentiment Analysis · NextEra Energy
Interactive scenario analysis: $NEE
Select earnings outcome
Upside momentum
Strong result, backed by real progress
EPS comes in above US$1.06. Management shows better contract progress and clearer steps on new power projects. That would suggest the backlog is moving closer to real revenue.
EPS Outcome
Above US$1.06
Infrastructure Signal
More contracts signed
Possible reaction
Sentiment improves
Sources & Data Methodology
Sources: Reporting dates and release times are from company investor relations calendars where marked Confirmed; otherwise they are GO Markets estimates. Consensus EPS, revenue and analyst-range data are sourced from Bloomberg and Earnings Whispers, as at 14 April 2026 (AEDT). Company guidance, backlog and operating metrics are sourced from the latest company filings or results presentations. Any scenario analysis reflects GO Markets analysis. Figures and schedules may change without notice.
From power to oil
If NextEra reflects the electricity side of the real economy story, Exxon Mobil reflects the fuel side. That matters in a market where supply risk can still reset inflation expectations, shift sector leadership and change how traders think about defensiveness.
$XOM| Q1 2026 REPORTING PERIOD
Exxon Mobil Corporation
NYSE | Energy | 1 May 2026
Confirmed
Global Release Countdown (BMO)
00:00:00:00
Consensus EPS
US$1.66
Consensus Revenue
US$82.47bn
AU/ASIA1 May | 8:30 pm
US/LATAM1 May | 6:30 am
Market Intelligence: $XOM
Analysis: XOM price drivers and scenarios
Liquids pricing effect
US$1.9-2.3bn
Support from stronger oil prices
Energy products timing
-US$3.3-4.1bn
Downstream timing drag
Analyst range
US$1.60-$1.85
Q1 EPS estimate range
AVG
LOW US$1.60AVG US$1.66HIGH US$1.85
The key question for Exxon Mobil is straightforward: can stronger oil and gas pricing offset weaker volumes and downstream pressure? For traders, this is a test of earnings quality, if prices do the lifting, the market may still want proof that operations are holding up.
Trade Execution: $XOM
Key signals to watch
Realised pricing
Markets want to see whether stronger oil and gas prices were enough to offset weaker production volumes.
Signal: Price strength vs Volume pressure
Timing and quality
Commentary on whether the downstream timing drag is temporary or a sign of deeper margin pressure.
Focus: Accounting effect vs Headwind
Guyana and Upstream
Markets want steady production growth from Guyana to keep the long-term story intact.
Watch: Delivery and Resilience
Refining margins
Even if crude helps, weaker refining or chemicals performance could limit the overall upside.
Focus: Downstream offset levels
Sentiment Analysis · Exxon Mobil
Interactive scenario analysis: $XOM
Select earnings outcome
Pricing offsets disruption
Strong result, with pricing support doing enough
EPS above US$1.85. Higher realised pricing more than offsets weaker volumes, and management suggests timing drag was less severe than expected. Upstream updates stay constructive.
EPS Outcome
Above US$1.85
Timing Impact
Smaller than feared
Possible reaction
Sentiment improves
Sources & Data Methodology
Sources: Reporting dates from company investor relations calendars; otherwise they are GO Markets estimates. Consensus EPS, revenue and analyst-range data from Bloomberg and Earnings Whispers as at 14 April 2026 (AEDT). Any scenario analysis reflects GO Markets analysis. Figures and schedules may change without notice.
The Bottom Line
The 2026 Reality Check
This late-April energy cluster is about more than three company reports. It is a live test of what the market wants to pay for in 2026.
Tesla ($TSLA)
Autonomy and energy shifting from promise to proof.
NextEra ($NEE)
Electricity demand turning into practical utility growth.
Exxon ($XOM)
Oil strength translating into durable earnings power.
Taken together, they offer a useful read on the part of the market that looks more physical, more capital-intensive and, for many traders, more real.
Your next earnings setup starts here
Stay ahead of major beats, misses, and market surprises. Log in to your terminal, open a new account, or explore our dedicated earnings academy.
The 8 April ceasefire announcement and parallel discussions around a 45-day truce have not resolved the Strait of Hormuz disruption. They have, for now, capped the worst-case scenario, but tanker traffic remains at a fraction of normal levels and Iran's demand for transit fees signals a structural shift, not a temporary one.
What began as a regional conflict has become a global energy shock, and the question for markets is no longer whether Hormuz was disrupted, but how permanently the disruption changes the pricing floor for oil.
Key takeaways
Around 20 million barrels per day (bpd) of oil and petroleum products normally pass through the Strait of Hormuz between Iran and Oman, equal to about one-fifth of global oil consumption and roughly 30% of global seaborne oil trade.
This is a flow shock, not an inventory problem. Oil markets depend on continuous throughput, not static storage.
If the disruption persists beyond a few weeks, Brent could shift from a short-term spike to a broader price shock, with stagflation risk.
Tanker traffic through the strait fell from around 135 ships per day to fewer than 15 at the peak of disruption, a reduction of approximately 85%, with more than 150 vessels anchored, diverted, or delayed.
A two-week ceasefire was announced on 8 April, with 45-day truce negotiations under way. Iran has separately signalled a demand for transit fees on vessels using the strait, which, if formalised, would represent a permanent geopolitical floor on energy costs.
Markets have begun rotating away from growth and technology exposure toward energy and defence names, reflecting a view that elevated oil is becoming a structural cost rather than a temporary risk premium.
Institutional Grade Performance
Master the Markets with MetaTrader 5
Trade hundreds of instruments with superior speed and advanced technical analysis. Harness full EA functionality to execute your strategy.
The Strait of Hormuz handles roughly 20 million barrels per day of oil and petroleum products, equal to about 20% of global oil consumption and around 30% of global seaborne oil trade. With global oil demand near 104 million bpd and spare capacity limited, the market was already tightly balanced before the latest escalation.
The strait is also a critical corridor for liquefied natural gas. Around 290 million cubic metres of LNG transited the route each day on average in 2024, representing roughly 20% of global LNG trade, with Asian markets the main destination.
The International Energy Agency (IEA) has described Hormuz as the world’s most important oil transit chokepoint, noting that even partial interruptions may trigger outsized price moves. Brent crude has moved above US$100 a barrel, reflecting both physical tightness and a rising geopolitical risk premium.
Source: US Energy Information Administration, dated June 17, 2025, using 2024 daily average
Tankers idle as flows slow
Shipping and insurance data now point to strain in real time. More than 85 large crude carriers are reported to be stranded in the Persian Gulf, while more than 150 vessels have been anchored, diverted or delayed as operators reassess safety and insurance cover. That would leave an estimated 120 million to 150 million barrels of crude sitting idle at sea.
Those volumes represent only six to seven days of normal Hormuz throughput, or a little more than one day of global oil consumption.
Updated shipping and insurance data now confirm more than 150 vessels have been anchored, diverted, or delayed, up from the 85 initially reported. The 1.3 days of global consumption coverage from idle crude remains the binding constraint: this is a flow shock, not a storage problem, and the ceasefire has not yet translated into meaningfully restored throughput.
🌋 Trump, volatility and Hormuz.
As tariff shocks collide with a ten year extreme in oil positioning, the margin for error is zero. See the technical markers and safe haven pivots defining the current risk environment.
Oil markets function on continuous movement. Refineries, petrochemical plants and global supply chains are calibrated to steady deliveries along predictable sea lanes. When flows through a chokepoint that carries roughly one-fifth of global oil consumption and around 30% of global seaborne oil trade are interrupted, the system can move from equilibrium to deficit within days.
Spare production capacity, largely concentrated within OPEC, is estimated at only 3 million to 5 million bpd. That falls well short of the volumes at risk if Hormuz flows are severely disrupted.
GO Markets — Idle Tankers: Days of Cover
Oil market analysis
How long do idle tankers last?
135M idle barrels — days of cover against each demand benchmark
vs. Strait of Hormuz daily flow (20M bbl/day)
6.75 daysof Hormuz throughput covered
6.75 days
0
5
10
15
20
25
30 days
vs. Global oil consumption (104M bbl/day)
1.3 daysof world demand covered
1.3 days
0
5
10
15
20
25
30 days
vs. US Strategic Petroleum Reserve release (1M bbl/day)
135 daysof full SPR release pace covered
135 days — but SPR exists to replace this role
0
5
10
15
20
25
30 days
135M
idle barrels on tankers (midpoint of 120–150M range)
~33%
of daily Hormuz flow that is idle storage, not transit
<31 hrs
is all idle storage against global daily consumption
Indicative market trajectories based on disruption severity
Scenarios for the weeks ahead
1–2 WEEKS
Ceasefire catch-up
Markets face catch-up repricing. Brent could consolidate in the US$105–US$115 range as risk premia unwind. Brent may trade lower (US$95–US$110) if strategic stocks bridge the temporary shortfall.
2–4 WEEKS
Infrastructure blitz
Shifts to structural supply shock. Brent moving toward US$150–US$200 cannot be ruled out. This is the stagflation trigger where energy costs constrain central bank flexibility.
STRUCTURAL
Geopolitical floor
Iran's transit fee demand creates a permanent input cost. The pre-crisis price structure (US$60–US$70) may not return, embedded in insurance and freight rates.
Critical Threshold
US$120 remains the level at which energy inflation becomes a direct Federal Reserve policy problem.
Inflation risks and macro spillovers
The inflationary impact of an oil shock typically arrives in waves. Higher fuel and energy prices may lift headline inflation quickly as petrol, diesel and power costs move higher.
Over time, higher energy costs may pass through freight, food, manufacturing and services. If the disruption persists, the combination of elevated inflation and slower growth could raise the risk of a stagflationary environment and leave central banks facing a difficult trade-off.
🛢️ Brent hits $100.
Exxon and SLB are leading the rotation out of tech. Get the price targets and technical support levels for the top 5 energy majors.
What makes the current episode particularly acute is the lack of slack in the global system.
Global supply and demand near 103 million to 104 million bpd leave little spare cushion when a chokepoint handling nearly 20 million bpd, or about one-fifth of global oil consumption, is compromised. Estimated spare capacity of 3 million to 5 million bpd, mostly within OPEC, would cover only a fraction of the volumes at risk.
Alternative routes, including pipelines that bypass Hormuz and rerouted shipping, can only partly offset lost flows, and usually at higher cost and with longer lead times.
Bottom line
Until transit through the Strait of Hormuz is restored and seen as credibly secure, global oil flows are likely to remain impaired and risk premia elevated. For investors, policymakers and corporate decision-makers, the core question is whether oil can move where it needs to go, every day, without interruption.
Market Opportunity
Don't just watch the squeeze. Trade the framework.
As positioning gaps hit decade extremes, access advanced charting tools and real time execution on the six key markets defining this cycle.


.jpeg)

