All eyes will be on the Jackson Hole in Wyoming this week, where the annual Jackson Hole Economic Symposium will be held by the Federal Reserve Bank of Kansas City. This years symposium will take place from 23rd until the 25th of August and the topic for the upcoming event will be “Changing Market Structure and Implications for Monetary Policy”. About Jackson Hole Economic Symposium The key feature of the meeting is the discussion that takes place between the participants.
Because of the high-profile participants and the topics that are discussed in the event, there is a considerable interest in the symposium, however, to help foster the open discussion that is critical to the event, the attendance is very limited. The event receives a large number of requests from media agencies worldwide, however, the press presence is also limited to a group that is selected to provide transparency to the symposium. Importance of the event The symposium is closely followed by financial markets participants around the world and over the past decade it has attracted more attention, this is mainly because what has happened in the past.
Some of the biggest monetary policies were initially revealed at the event, although they were not formally announced. During the event, any unexpected comment from any participants can influence the global financial markets. Here are some notable moments from the Jackson Hole Symposium: 2005 – Raghuram Rajan (then the professor at the University of Chicago and former governor of Reserve Bank of India) warned about risks that the financial system had absorbed throughout the years.
Three years later, the US subprime mortgage crisis erupted into the global financial crisis. 2012 – Michael Woodford (macroeconomist and monetary theorist, Columbia University) presented where he said that Fed’s stance on keeping its main interest rate near zero until a certain time would reflect pessimism about the speed of the economy’s recovery. Later that year, the Fed announced it would keep rates near zero until unemployment fell to 6.50% and inflation did not climb above 2.50%. 2014 – Mario Draghi (ECB president) hinted that the ECB was edging closer to embarking on its QE path. During the event, Mario Draghi said that ECB could use ‘all the available instruments’.
His announcement came just two months after ECB introduced negative deposit rates in the Eurozone, the financial markets rallied during his speech at the Jackson Hole. The symposium is a must watch financial market event and it is worth keeping an eye on the discussions and speeches during the event as we may see statements from some of the most influential people from around the world. This year, Federal Reserve Chairman Jerome Powell will headline the event in Jackson Hole with a speech about monetary policy in a changing economy, according to the Fed Board so it’s time to mark your calendars!
Klāvs Valters Market Analyst
By
Adam Taylor
CFTe. Director, Go Markets London.
The information provided is of general nature only and does not take into account your personal objectives, financial situations or needs. Before acting on any information provided, you should consider whether the information is suitable for you and your personal circumstances and if necessary, seek appropriate professional advice. All opinions, conclusions, forecasts or recommendations are reasonably held at the time of compilation but are subject to change without notice. Past performance is not an indication of future performance. Go Markets Pty Ltd, ABN 85 081 864 039, AFSL 254963 is a CFD issuer, and trading carries significant risks and is not suitable for everyone. You do not own or have any interest in the rights to the underlying assets. You should consider the appropriateness by reviewing our TMD, FSG, PDS and other CFD legal documents to ensure you understand the risks before you invest in CFDs.
Durante más de 110 años, la Reserva Federal (la Fed) ha operado a una distancia deliberada de la Casa Blanca y el Congreso.
Es la única agencia federal que no rinde informes a ninguna rama de gobierno en la forma en que lo hacen la mayoría de las agencias, y puede implementar políticas sin esperar la aprobación política.
Estas políticas incluyen las decisiones sobre tasas de interés, el ajuste de la oferta monetaria, los préstamos de emergencia a los bancos, los requisitos de reserva de capital para los bancos y la determinación de qué instituciones financieras requieren una mayor supervisión.
La Fed puede actuar de manera independiente en todas estas decisiones económicas críticas y más.
Pero, ¿por qué el gobierno de Estados Unidos permite esto? ¿Y por qué es que casi todas las grandes economías han adoptado un modelo similar para su banco central?
La fundación de la independencia de la Fed: el pánico de 1907
La Fed se estableció en 1913 tras el Pánico de 1907, una importante crisis financiera. Vio el colapso de los principales bancos, el mercado de valores caer casi 50% y los mercados crediticios se congelaron en todo el país.
En ese momento, Estados Unidos no tenía autoridad central para inyectar liquidez en el sistema bancario durante emergencias o para evitar que las quiezas bancarias en cascada derribaran a toda la economía.
J.P. Morgan orquestó personalmente un rescate utilizando su propia fortuna, destacando lo frágil que se había vuelto el sistema financiero estadounidense.
El debate que siguió reveló que si bien Estados Unidos claramente necesitaba un banco central, los políticos eran vistos objetivamente como mal posicionados para manejarlo.
Los intentos anteriores de la banca central habían fracasado en parte debido a la interferencia política. Los presidentes y el Congreso habían utilizado la política monetaria para servir a objetivos políticos a corto plazo en lugar de la estabilidad económica a largo plazo.
Por lo que se decidió que se crearía un organismo independiente responsable de tomar todas las decisiones económicas importantes. Esencialmente, la Fed se creó porque no se podía confiar en que los políticos, que enfrentan elecciones y presión pública, tomaran decisiones impopulares cuando fuera necesario para la economía a largo plazo.
Si bien la Fed está diseñada para ser un organismo autónomo, separado de la influencia política, todavía tiene rendición de cuentas al gobierno de Estados Unidos (y por lo tanto a los votantes estadounidenses).
El Presidente es responsable de nombrar a la Presidencia de la Fed y a los siete Gobernadores de la Junta de la Reserva Federal, sujeto a confirmación por parte del Senado.
Cada Gobernador sirve un mandato de 14 años, y el Presidente sirve un mandato de cuatro años. Los términos de los Gobernadores están escalonados para evitar que una sola administración pueda cambiar toda la junta de la noche a la mañana.
Más allá de esta junta “principal”, existen doce Bancos regionales de la Reserva Federal que operan en todo el país. Sus presidentes son designados por juntas del sector privado y aprobados por los siete gobernadores de la Fed. Cinco de estos presidentes votan las tasas de interés en un momento dado, junto a los siete Gobernadores.
Esto crea una estructura descentralizada donde ninguna persona o partido político puede dictar la política monetaria. Cambiar la dirección de la Fed requiere consenso entre múltiples personas designadas de diferentes administraciones.
El caso de la independencia de la Fed: Nixon, Burns y la resaca inflacionaria
El argumento más fuerte para mantener a la Fed independiente proviene de la época de Nixon como presidente en la década de 1970.
Nixon presionó al presidente de la Fed, Arthur Burns, para que mantuviera bajas las tasas de interés en el período previo a las elecciones de 1972. Burns cumplió, y Nixon ganó de manera arrollada. Durante la siguiente década, tanto el desempleo como la inflación subieron simultáneamente (comúnmente conocida ahora como “estanflación”).
A finales de la década de 1970, la inflación superaba el 13 por ciento, Nixon estaba fuera del cargo y era hora de nombrar un nuevo presidente de la Fed.
Ese nuevo presidente de la Fed fue Paul Volcker. Y a pesar de la presión pública y política para bajar las tasas de interés y reducir el desempleo, empujó la tasa hasta más del 19 por ciento para tratar de romper la inflación.
La decisión desencadenó una recesión brutal, con un desempleo que alcanzó casi el 11 por ciento.
Pero a mediados de la década de 1980, la inflación había vuelto a caer a los bajos de un solo dígito.
Inflación anterior a la era Volcker vs inflación de la era Volcker | FRED
Volcker se mantuvo firme donde los políticos no independientes habrían retrocedido ante el desploma de los números de las encuestas.
La “era Volcker” ahora se enseña como una clase magistral de por qué los bancos centrales necesitan independencia. El doloroso medicamento funcionó porque la Fed podría soportar una reacción política que habría roto a una institución menos autónoma.
¿Los demás bancos centrales son independientes?
Casi todas las principales economías desarrolladas tienen un banco central independiente. El Banco Central Europeo, el Banco de Japón, el Banco de Inglaterra, el Banco de Canadá y el Banco de la Reserva de Australia operan con una autonomía similar de sus gobiernos como la Fed.
No obstante, hay ejemplos de naciones desarrolladas que se han alejado de los bancos centrales independientes.
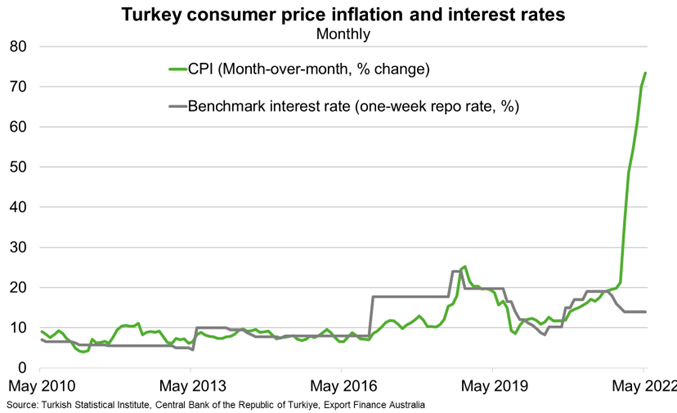
En Turquía, el presidente obligó a su banco central a mantener tasas bajas incluso cuando la inflación se disparó más allá del 85 por ciento. La decisión sirvió a objetivos políticos a corto plazo mientras devastaba el poder adquisitivo de la gente común.
Las recurrentes crisis económicas de Argentina se han visto exacerbadas por la política monetaria subordinada a las necesidades políticas. La hiperinflación de Venezuela se aceleró luego de que el gobierno aseverara un mayor control sobre su banco central.
El patrón tiende a mostrar que cuanto más control tiene el gobierno sobre la política monetaria, más se inclina la economía hacia la inestabilidad y una mayor inflación.
Los bancos centrales independientes pueden no ser perfectos, pero históricamente han superado a la alternativa.
Las tasas de interés de Turquía cayeron en 2022 a pesar de que la inflación se disparó
¿Por qué los mercados se preocupan por la independencia de la Fed?
Los mercados generalmente prefieren la previsibilidad, y los bancos centrales independientes toman decisiones más predecibles.
Los funcionarios de la Fed a menudo describen cómo planean ajustar la política y cuáles son sus puntos de datos preferidos.
Actualmente, el Índice de Precios al Consumidor (IPC), el índice de Gastos de Consumo Personal (PCE), los informes mensuales de empleos de la Oficina de Estadísticas Laborales (BLS) y las liberaciones trimestrales del PIB forman expectativas sobre la trayectoria futura de las tasas de interés.
Esta transparencia y previsibilidad ayudan a las empresas a mapear inversiones, a los bancos a establecer tasas de préstamo y a la gente común a planificar decisiones financieras importantes.
Cuando la influencia política se infiltra en estas decisiones, introduce incertidumbre. En lugar de seguir patrones predecibles basados en datos publicados públicamente, las tasas de interés pueden cambiar en función de consideraciones electorales o preferencias políticas, lo que dificulta la planificación a largo plazo.
Los mercados reaccionan a esta incertidumbre a través de la volatilidad de los precios de las acciones, las posibles subidas del rendimiento de los bonos y la fluctuación de los valores de las divisas.
La lógica perdurable
La independencia de la Reserva Federal se trata de reconocer que el dinero estable y el crecimiento sustentable requieren instituciones capaces de tomar decisiones impopulares cuando los fundamentos económicos las exigen.
Las elecciones siempre crearán presión para condiciones monetarias más fáciles. La inflación siempre tentará a los formuladores de políticas a retrasar ajustes dolorosos. Y el calendario político nunca se alineará perfectamente con los ciclos económicos.
La independencia de la Fed existe para navegar estas tensiones eternas, no perfectamente, pero mejor de lo que el control político ha logrado a lo largo de la historia.
Es por ello que este principio, forjado en pánicos financieros y refinado a través de sucesivas crisis, sigue siendo fundamental para el funcionamiento de las economías modernas. Y es por eso que los debates sobre la independencia de los bancos centrales, siempre que surgen, tocan algo fundamental sobre cómo las democracias pueden mantener la prosperidad a largo plazo.
El avance del oro por encima de los 5.000 dólares estadounidenses y el aumento de la plata a través de 100 dólares este año podrían ser uno de los libros de historia para los comerciantes de metales (de una forma u otra).
Datos rápidos
La elevada demanda de refugio seguro eleva los objetivos de oro de US$5,400 a US$6,000 después de la ruptura de US$5,000 a principios de año.
La inteligencia artificial (IA) y el aumento de la infraestructura del centro de datos podrían ayudar a impulsar la demanda de plata y cobre.
La continua incertidumbre geopolítica y el cambio de la política monetaria podrían desencadenar la volatilidad de los metales a lo largo del año.
Los 5 mejores metales para ver en 2026
1. Oro
La ruptura del oro por encima de los 5.100 dólares llegó tres cuartas partes antes de algunos pronósticos. Con Bank of America elevando rápidamente su objetivo de fin de año a 6.000 dólares y Goldman Sachs proyectando US$5,400, el producto de refugio seguro sigue siendo el mayor activo en foco para 2026.
Controladores clave:
Los bancos centrales están comprando actualmente un promedio de 60 toneladas de oro al mes, en comparación con 17 toneladas anteriores a 2022.
Se cotizan dos recortes de tasas de la Fed para 2026, lo que reduce el costo de oportunidad de mantener activos no rendientes como el oro.
Las políticas arancelarias de Trump, las tensiones en Medio Oriente y las preocupaciones de sostenibilidad fiscal están manteniendo elevada la demanda de refugio seguro.
La participación del oro en los activos financieros totales alcanzó 2.8% en el tercer trimestre de 2025, con margen para crecer a medida que entra en acción el FOMO minorista.
Qué ver
Jerome Powell será reemplazado como presidente de la Fed en mayo de 2026. La dirección de la política real después del reemplazo puede diferir de las expectativas actuales del mercado para los recortes.
Si se mantienen las coberturas geopolíticas hacia refugios seguros o si hay un desenrollamiento como las elecciones estadounidenses posteriores a 2024.
La potencial armamonización de las tenencias de activos en dólares por parte de las naciones europeas como respuesta a los aranceles estadounidenses.
La plata es el metal que más se ha beneficiado del auge de la IA de 2025, con su aumento a US$112 máximos históricos para dar inicio a 2026 (70% por encima del valor fundamental según la señal de Bank of America), lo que demuestra su potencial volátil.
Controladores clave
La demanda industrial de infraestructura de IA, vehículos solares y eléctricos (EV), semiconductores y centros de datos actualmente no tiene un sustituto viable para la conductividad de la plata.
Seis años consecutivos de déficit de oferta, con existencias por encima del suelo agotándose y cuellos de botella reciclando limitando el suministro secundario.
La óptica de las políticas puede importar. La decisión de Estados Unidos de agregar plata a su lista de “minerales críticos” ha sido citada como un factor potencial de volatilidad, incluso en torno al riesgo de política comercial.
La participación minorista puede amplificar los movimientos de precios, particularmente cuando la demanda de oro se vuelve “demasiado cara”.
Qué ver
Si la demanda de paneles solares continúa su trayectoria, o si 2025 fue el pico.
Si el suministro de reciclaje responde a precios récord aumentando la capacidad de refinación de plata y procesamiento de materiales.
Cómo se mueven las tasas de inventario y arrendamiento de intercambio como posibles señales de estanqueidad física.
La historia de Copper en 2026 depende de la continua demanda del centro de datos, el crecimiento de la infraestructura de energía renovable y el mercado inmobiliario en dificultades de China.
Controladores clave
Se proyecta que el consumo de cobre del centro de datos alcance las 475.000 toneladas en 2026, 110.000 toneladas más que en 2025.
Las huelgas de trabajadores en Chile y los retrasos en el reinicio de Grasberg están manteniendo el mercado del Cobre estructuralmente apretado.
La decisión arancelaria de Estados Unidos sobre las importaciones de cobre refinado se espera a mediados de 2026 (15% + actualmente previsto), creando posibles existencias y distorsiones del flujo comercial.
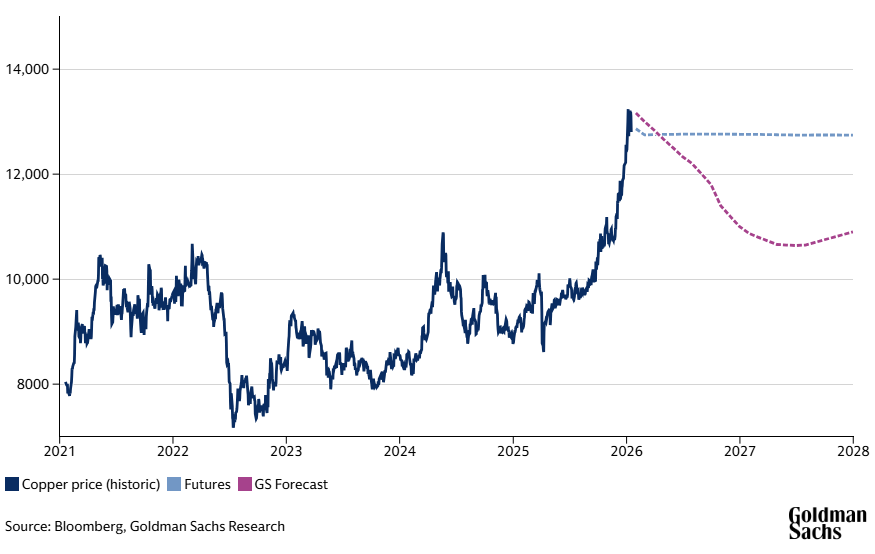
Goldman Sachs ha pronosticado que la infraestructura de la red eléctrica y la construcción de EV podrían agregar “otro valor de Estados Unidos” a la demanda de cobre para 2030.
La actual debilidad inmobiliaria china está creando incertidumbre en la demanda, lo que podría compensar el gasto en infraestructura.
Qué ver
Ya sea que Grasberg rampe la producción sin problemas o se enfrente a nuevos contratiempos.
Efectividad del estímulo del mercado inmobiliario chino.
Plazo y magnitud real de la implementación tarifaria.
Movimientos premium de Yangshan que señalizaron la demanda física real frente al posicionamiento financiero.
Goldman Sachs pronostica que los precios del cobre bajen a $11,000 por tonelada para fines de 2026
4. Aluminio
Al cotizar cerca de máximos de tres años de 3.200 dólares, el aluminio enfrenta una tensión continua en 2026, ya que el techo de capacidad de China obliga a los mercados globales a ajustarse.
Controladores clave
El límite de capacidad de 45 millones de toneladas de China se alcanzó en 2025. Por primera vez en décadas, la producción china no puede expandirse, terminando potencialmente el 80% del crecimiento mundial de la oferta.
A medida que aumentan los precios del cobre, Reuters ha informado que algunos fabricantes han estado sustituyendo aluminio por cobre en ciertas aplicaciones a medida que cambian los precios relativos.
Qué ver
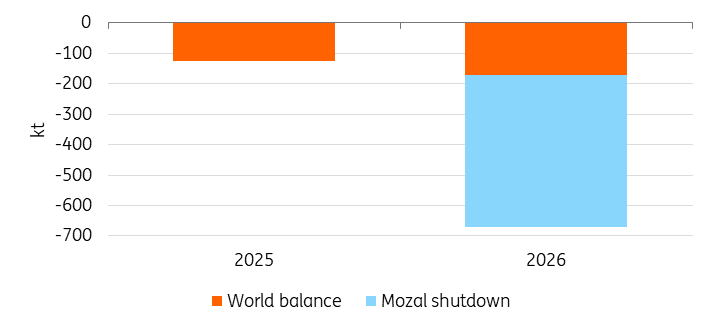
South32 ha dicho que se espera que Mozal Aluminium se ponga en cuidado y mantenimiento alrededor del 15 de marzo de 2026, eliminando así la importante oferta de 560,000 toneladas de Mozambique.
Si las adiciones de capacidad offshore de Indonesia y China pueden compensar el techo interno chino.
El reinicio de 50 mil toneladas de Mount Holly de Century Aluminium en el segundo trimestre podría proporcionar una señal para la industria en general, ya que se espera que la fundición alcance la producción completa para el 30 de junio de 2026.
Proyectado 2026 Déficit de aluminio tras cierre de Mozal. Fuente: IAI, WBMS, ING Research
5. Platino
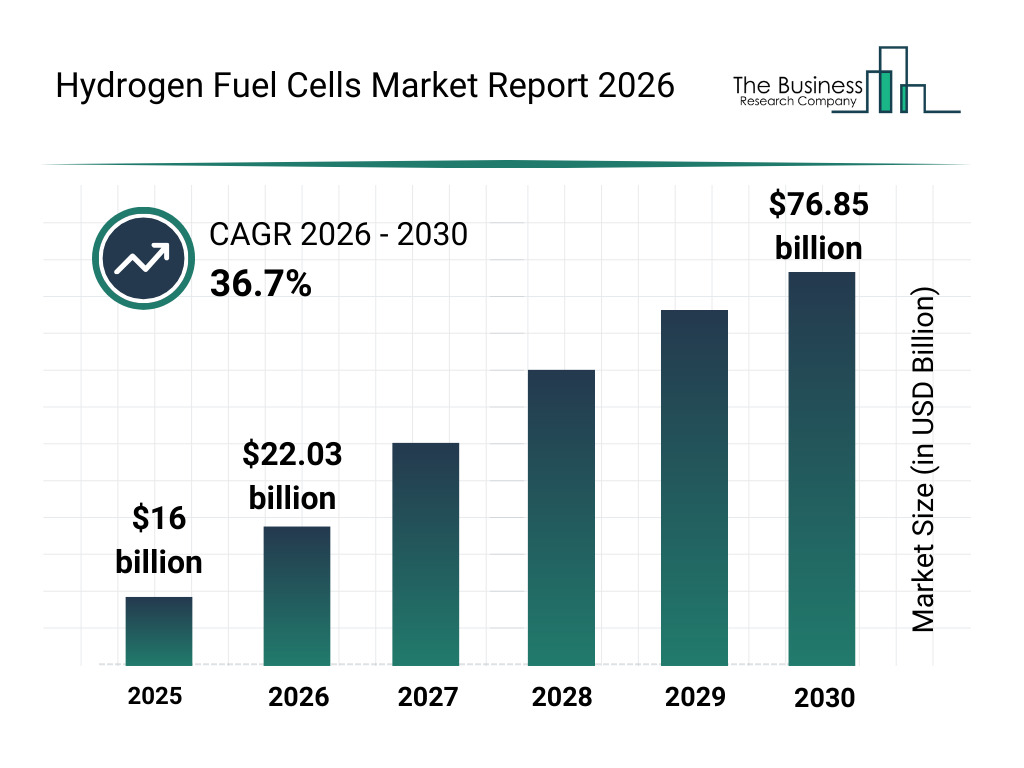
La ruptura del platino por encima de los US$2,800 sigue a tres años consecutivos de déficit de suministro y una mayor adopción de celdas de combustible de hidrógeno (para lo cual es un componente vital).
Controladores clave
El Consejo Mundial de Inversiones en Platino (WPIC) ha pronosticado un déficit de oferta significativo de 850.000 onzas en 2026 lo que podría drenar los inventarios, con una producción nueva limitada entrando en línea.
WPIC pronostica una captación de 875,000 a 900,000 oz para 2030 para camiones pesados, autobuses y electrolizadores de hidrógeno verdes.
La sustitución de paladio a platino en convertidores catalíticos está aumentando en la producción de EV.
Qué ver
Respuesta de abasto por parte de los productores. Platreef y Bakubung están agregando 150,000 oz, pero la disciplina de producción podría limitar un ramp-up más amplio.
Los aranceles estadounidenses sobre el paladio ruso podrían crear una demanda invertida de platino en la producción de EV.
El ritmo de la inversión en infraestructura de hidrógeno y las tasas de adopción de vehículos pesados en Europa, China y Estados Unidos.
La demanda de joyería china podría entrar en juego. Apenas una sustitución del 1% del oro podría ampliar el déficit de platino en un 10% de la oferta mundial.
Crecimiento proyectado de celdas de combustible de hidrógeno 2025-2030
The Australian Securities Exchange (ASX) is one of the world's top 20 exchanges, hosting over 2,000 listed companies worth approximately $2 trillion.
Quick Facts:
The ASX operates as Australia's primary stock exchange, combining market trading, clearinghouse operations, and trade and payment settlement.
It represents roughly 80% of the Australian equity market value through its flagship ASX 200 index.
2,000+ companies and 300+ ETFs are listed on the exchange, spanning from mining giants to tech innovators.
How does the ASX work?
The ASX combines three critical functions in one system.
As a market operator, it provides the electronic platform where buyers and sellers meet. Trading occurs through a sophisticated computer system that matches orders in milliseconds, replacing the traditional floor-based trading that once defined stock exchanges globally.
The exchange also acts as a clearinghouse, ensuring trades settle correctly. When you buy shares, the ASX guarantees the transaction completes, managing the transfer of securities and funds between parties.
Finally, it serves as a payments facilitator, processing the money flows that accompany each trade. This integrated approach reduces settlement risk and keeps the market running smoothly.
What are ASX trading hours?
The ASX operates from 10:00am to 4:00pm Sydney time (AEST/AEDT) on business days, with a pre-open phase from 7:00am.
Stocks open alphabetically in staggered intervals starting at 10:00am, followed by continuous trading until the closing auction at 4:00pm.
The exchange observes Australian public holidays and adjusts for daylight saving time between October and April, which can affect coordination with international markets.
ASX trading hours by time zone
Phase
Sydney (AEST)
Tokyo (JST)
London (BST)
New York (EDT)
Pre-Open
7:00am - 10:00am
6:00am - 9:00am
10:00pm - 1:00am
5:00pm - 8:00pm*
Normal Trading
10:00am - 4:00pm
9:00am - 3:00pm
1:00am - 7:00am
8:00pm - 2:00am*
Closing Auction
4:00pm - 4:10pm
3:00pm - 3:10pm
7:00am - 7:10am
2:00am - 2:10am
*Previous day. Note: Times shown assume daylight saving time in effect (AEST/BST/EDT). Japan does not observe daylight saving. Time differences vary when regions switch between standard and daylight saving at different dates.
Top ASX Indices
S&P/ASX 200
This is the exchange's flagship index. It tracks the 200 largest companies by market capitalisation and represents approximately 80% of Australia's equity market.
It serves as the primary benchmark for most investors and fund managers and is rebalanced quarterly to ensure it reflects the current market leaders.
The ASX also breaks down into 11 sector-specific indices, allowing investors to track performance in areas like financials, materials, healthcare, and technology.
These indices can help identify which parts of the Australian economy are strengthening or weakening.
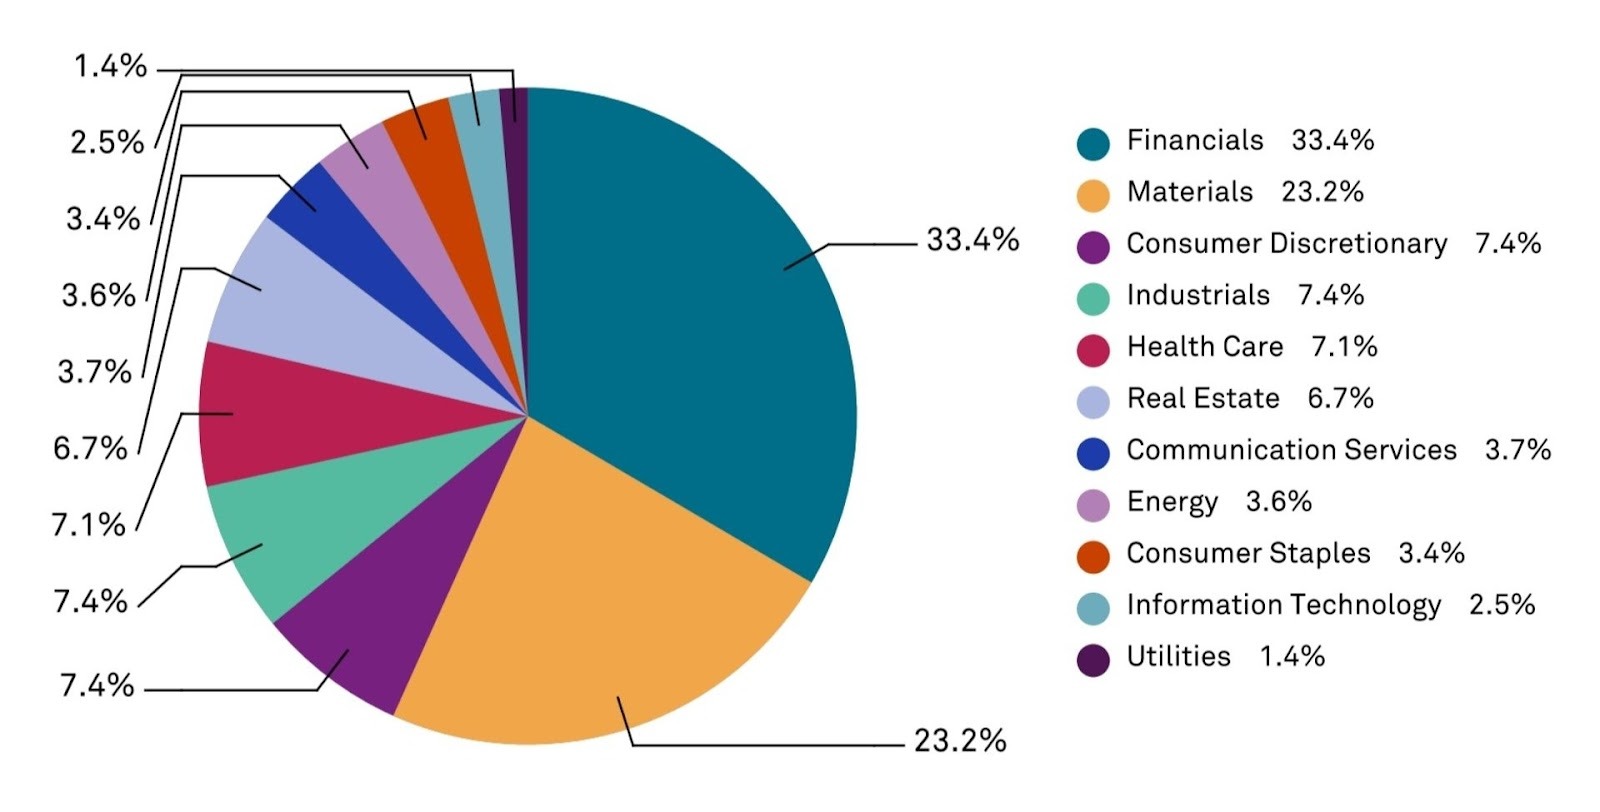
ASX sector breakdown as of 31 December 2025. Source: S&P Global
Financials dominates as the largest sector, driven by Commonwealth Bank, NAB, Westpac, and ANZ. These banking giants provide lending, wealth management, and insurance services across Australia.
Materials ranks second, led by mining powerhouses BHP and Rio Tinto. This sector extracts and processes resources, including iron ore, coal, copper, and gold.
Consumer Discretionary includes retailers, media companies, and hospitality groups that benefit when household spending rises.
Industrials encompasses construction firms, airlines, and professional services businesses.
Healthcare features companies like CSL, a global biotech leader, and Cochlear, which produces hearing implants.
Real Estate features property developers and Real Estate Investment Trusts (REITs) that own and manage commercial and residential assets.
Communication Services includes telecommunications providers like Telstra alongside media and entertainment companies.
Energy tracks oil and gas producers (many renewable energy companies typically fall under utilities).
Consumer Staples covers essential goods providers like supermarkets and food producers.
Information Technology includes software developers and IT services firms.
Utilities covers electricity, gas, and water suppliers, including renewable energy.
ASX Symbol
Sector
Top Stocks
% of ASX 200
XFJ
Financials
CBA, NAB, ANZ
33.4%
XMJ
Materials
Orica, Amcor, BHP
23.2%
XDJ
Consumer Discretionary
Harvey Norman, Crown
7.4%
XNJ
Industrials
Qantas, Transurban
7.4%
XHJ
Health Care
ResMed, CSL and Cochlear
7.1%
XRE
Real Estate
Mirvac, LendLease, Westfield
6.7%
XTJXIJ
Communication Services
Telstra, Airtasker
3.7%
XEJ
Energy
Santos, Woodside
3.6%
XSJ
Consumer Staples
Woolworths, Westfarmers
3.4%
XIJ
Information Technology
Dicker Data, Xero
2.5%
XUJ
Utilities
AGL, APA Group
1.4%
Data accurate as of 31 December 2025
Top ASX companies
Three companies consistently lead the S&P/ASX 200 by market capitalisation.
Commonwealth Bank (Mkt cap: A$259 bln)
Commonwealth Bank holds the top position on the ASX as Australia's biggest lender.
Founded in 1911 and fully privatised by 1996, CBA offers retail banking, business lending, wealth management, and insurance.
Its performance often signals the health of the domestic economy.
BHP Group (Mkt cap: A$241 bln)
BHP Group stands as the world's largest mining company.
Its diversified portfolio spans iron ore, copper, coal, and nickel operations globally.
It serves as a bellwether for Australian commodity markets.
CSL Limited (Mkt cap: A$182 bln)
CSL Limited leads the Australian healthcare sector as a global biotech firm.
Established in 1916, CSL develops treatments for rare diseases and manufactures influenza vaccines.
The company demonstrates Australian innovation competing on the world stage.
The ASX serves as a vital mechanism for capital formation in Australia. It tends to provide price signals that reflect market expectations.
When share prices rise, it suggests optimism about economic conditions. Falling markets may indicate concerns about future growth.
Australian companies raise funds through initial public offerings and follow-on share sales on the ASX, using proceeds to expand operations, fund research, or pay down debt.
Investors in these shares benefit from potential capital gains and dividend income. Many Australians build retirement savings through superannuation funds that invest heavily in ASX-listed companies.
Employment in financial services also depends partly on a healthy stock market. Brokers, analysts, fund managers, and supporting roles exist because of active capital markets.
Key takeaways
The ASX functions as a market operator, clearinghouse, and payments facilitator, providing the infrastructure that enables capital formation and supports retirement savings for millions of Australians.
Its flagship index, the S&P/ASX 200, tracks the 200 largest companies and captures about 80% of market capitalisation, while the All Ordinaries index covers the top 500.
Financials and Materials dominate the exchange, led by Commonwealth Bank, BHP, and CSL, reflecting Australia's strength in banking and resources.
April's US earnings season is landing in a market that wants more than a good story. JPMorgan has already set a high bar with a strong result, and attention is now shifting to the engine room of the S&P 500: AI infrastructure where three companies are at the centre of that story.
Why this earnings window matters for AI
Microsoft, Alphabet and NVIDIA are not just participants in the AI cycle, they are building the physical and software architecture that other companies depend on: the chips, the cloud regions, the models and the tools. If this spending is going to deliver returns, the first signs may start to show in their quarterly results over the next few weeks.
Each company represents a different test.
Microsoft: Whether enterprise AI adoption is translating into revenue and margin expansion
Alphabet: Whether owning the full stack, from chips to cloud to distribution, is a durable advantage or simply an expensive position to defend
NVIDIA: Whether the hardware cycle is still holding, accelerating or starting to level out
In 2026, the question is no longer whether AI investment is happening, the capital commitments are substantial and already publicly stated. The question is whether that spending is generating returns quickly enough to justify the scale of those bets.
IMPORTANT: REPORTING SCHEDULES CAN CHANGE WITHOUT NOTICE. REPORTING DATES AND RELEASE TIMES ARE FROM COMPANY INVESTOR RELATIONS CALENDARS WHERE MARKED CONFIRMED; OTHERWISE THEY ARE GO MARKETS ESTIMATES. CONSENSUS EPS, REVENUE AND ANALYST-RANGE DATA ARE FROM THIRD-PARTY MARKET CONSENSUS SOURCES, AS OF 16 APRIL 2026 (AEST). COMPANY GUIDANCE, BACKLOG AND OPERATING METRICS ARE FROM THE LATEST COMPANY FILINGS OR RESULTS PRESENTATIONS UNLESS STATED OTHERWISE. FIGURES AND SCHEDULES MAY CHANGE WITHOUT NOTICE.
$MSFT| Q1 2026 REPORTING PERIOD
Microsoft Corporation
NASDAQ | Technology | 29 Apr 2026
Confirmed
Global Release Countdown (AMC)
00:00:00:00
Consensus EPS
US$4.04
Consensus Revenue
US$81.40bn
AU/ASIA30 Apr | 6:05 am
US/LATAM29 Apr | 4:05 pm
Market Intelligence: $MSFT
Analysis: Microsoft price drivers and scenarios
Azure Growth Target
37-38%
Constant currency projection
AI Contribution
+6-8 pts
Azure revenue from AI services
FY26 Capex
US$146bn
Total infrastructure spending
AVG
LOW US$3.86AVG US$4.04HIGH US$4.14
Microsoft is being tested on a specific question: can it turn heavy AI spending into margin expansion? A result above US$4.14 could ease concerns over "capex fatigue" and demonstrate whether Azure growth is re-accelerating alongside enterprise AI adoption.
Factors that could move the markets
Azure growth rate
Watch if constant-currency growth re-accelerates above 39%, suggesting AI workloads are filling new capacity rather than sitting idle.
Signal: Capacity Utilisation
Workplace agent adoption
The shift to autonomous agents is central. Clear enterprise uptake in Dynamics 365 supports the high-tier subscription thesis.
Signal: Software Monetisation
Maia 200 cost savings
If the in-house AI chip is lowering inference costs at production levels, gross margins may start to recover from recent compression.
Watch: Gross Margin Recovery
Regulatory backdrop
Ongoing scrutiny of cloud bundling practices remains a potential headwind; management commentary here is vital for the long-term view.
Watch: Bundling Compliance
Sentiment Analysis · Microsoft Corp.
Interactive scenario analysis: $MSFT
Select earnings outcome
AI Scaling Proof
Strong result, backed by real AI progress
EPS above US$4.14 and Azure re-acceleration above 39% could support the view that AI spending is starting to translate into commercial returns. Workplace Agents show measurable ROI and FY26 guidance is raised.
EPS Outcome
Above US$4.14
Cloud Signal
Accelerating
Guidance
Raised
Possible reaction
Strong rally
Sources & Data Methodology
Sources: Reporting dates and release times are from company investor relations calendars where marked Confirmed; otherwise they are GO Markets estimates. Consensus EPS, revenue and analyst-range data are sourced from Bloomberg and Earnings Whispers, as at 16 April 2026 (AEST). Company guidance, backlog and operating metrics are sourced from the latest company filings or results presentations. Any scenario analysis reflects GO Markets analysis. Figures and schedules may change without notice.
Expanded Coverage
Beyond the chipmakers
As the "show me the money" year unfolds, discover how AI demand is impacting Tesla, NextEra, and Exxon.
Alphabet has transformed from a search business into a sprawling AI infrastructure play, and this result will test whether that transformation is delivering. The US$185 billion capex forecast for 2026 is extraordinary, close to double last year's spending.
EPS is expected to decline slightly year on year, precisely because that infrastructure spending is consuming capital. The question is whether Google Cloud's growth is fast enough to show a credible path back to margin recovery, and whether Ironwood, the seventh-generation custom AI chip, is proving its cost-per-query advantage at scale.
$GOOGL| Q1 2026 REPORTING PERIOD
Alphabet Inc.
NASDAQ | Technology | 29 Apr 2026
Confirmed
Global Release Countdown (AMC)
00:00:00:00
Consensus EPS
US$2.64
Consensus Revenue
US$92.14bn
AU/ASIA30 Apr | 6:30 am
US/LATAM29 Apr | 4:30 pm
Market Intelligence: $GOOGL
Analysis: Alphabet price drivers and scenarios
Cloud growth
48% YoY
Compared with last quarter
Ironwood TPU
10x peak
Vs previous-generation chip
2026 Capex
US$185bn
Double last year's spending
AVG
LOW US$2.50AVG US$2.64HIGH US$2.80
Alphabet has shifted to being viewed as a broader AI infrastructure play. The question is whether Cloud growth can support a path back to margin recovery while the massive US$185bn infrastructure buildout absorbs capital.
Factors that could move the markets
Google Cloud momentum
Markets are watching if the 48% growth rate holds, specifically among customers using Ironwood TPUs for large-scale AI.
Signal: Enterprise AI Adoption
Search & AI overview
If compute-intensive AI summaries are monetising through ads, it supports core search economics in the AI era.
Focus: Search Economics
Capex & margin trajectory
With free cash flow under pressure from US$185bn capex, markets want to know when infrastructure investment will moderate.
Watch: Spending Ceiling
DOJ antitrust risk
Management commentary on the legal timeline for Chrome or Android divestiture appeals will influence how risk is priced.
Watch: Regulatory Remedies
Sentiment Analysis · Alphabet Inc.
Interactive scenario analysis: $GOOGL
Select earnings outcome
Efficiency Proof
Ironwood efficiency drives upside
EPS above US$2.80 and cloud growth above 45% suggest Ironwood is cutting costs and strengthening Google’s advantage faster than expected.
EPS outcome
Above US$2.80
Cloud Signal
Strong growth
Waymo
Accelerating
Reaction
Sentiment improves
Sources & Data Methodology
Sources: Reporting dates and release times are from company investor relations calendars where marked Confirmed; otherwise they are GO Markets estimates. Consensus EPS, revenue and analyst-range data are sourced from Bloomberg and Earnings Whispers, as at 16 April 2026 (AEST). Company guidance, backlog and operating metrics are sourced from the latest company filings or results presentations. Any scenario analysis reflects GO Markets analysis. Figures and schedules may change without notice.
NVIDIA: the hardware cycle read through
NVIDIA is no longer simply a chip company. It has become what analysts now describe as the central bank of compute, the entity whose product determines how much AI capacity the world can actually deploy.
The upcoming Q1 FY2027 result will test whether the new Vera Rubin R100 GPU architecture, which entered mass production ahead of schedule, is already contributing to revenue, and whether NVIDIA can sustain gross margins above 75% as inference, rather than training, becomes the dominant workload. Inference is more competitive and more price-sensitive than training, so margin resilience here matters.
$NVDA| Q1 2026 REPORTING PERIOD
NVIDIA Corporation
NASDAQ | Semiconductors | 20 May 2026
Confirmed
Global Release Countdown (AMC)
00:00:00:00
Consensus EPS
US$1.70
Consensus Revenue
US$78.42bn
AU/ASIA21 May | 6:30 am
US/LATAM20 May | 4:30 pm
Market Intelligence: $NVDA
Analysis: NVIDIA price drivers and scenarios
Revenue growth
73% YoY
Last quarter benchmark
Data centre share
91%+
Share of total revenue
Rubin R100
In production
Mass production began April 2026
AVG
LOW US$76bnAVG US$78bnHIGH US$81bn+
NVIDIA’s outlook depends on whether Rubin R100 can keep gross margins above 75% as inference becomes a bigger part of demand. Because inference is more price-sensitive than training, margins are the key test.
Factors that could move the markets
Rubin ramp-up
Watch whether Rubin production can scale smoothly without disrupting the Blackwell transition.
Signal: supply chain continuity
Inference margins
The key test is whether NVIDIA can keep gross margins above 75% as inference revenue grows.
Signal: pricing power holds up
Sovereign AI demand
Government-backed investment in Europe and the Middle East could broaden the base beyond hyperscalers.
Signal: market expansion
CUDA regulatory risk
Any US or European scrutiny of NVIDIA’s software advantage could move the stock regardless of the revenue result.
Signal: software moat under review
Sentiment Analysis · NVIDIA Corp.
Interactive scenario analysis: $NVDA
Select earnings outcome
Rubin ramp supports growth
Rubin ramp supports growth
Revenue above US$81 billion may suggest the Rubin ramp is tracking ahead of expectations. That could support the view that AI demand is broadening into sovereign AI and enterprise markets, helping extend visibility into 2027.
Revenue Outcome
Above US$81bn
Gross Margin
Above 75%
Workload
Inference strong
Reaction
Positive read-through
Sources & Data Methodology
Sources: Reporting dates and release times are from company investor relations calendars where marked Confirmed; otherwise they are GO Markets estimates. Consensus EPS, revenue and analyst-range data are sourced from Bloomberg and Earnings Whispers, as at 16 April 2026 (AEST). Company guidance, backlog and operating metrics are sourced from the latest company filings or results presentations. Any scenario analysis reflects GO Markets analysis. Figures and schedules may change without notice.
Thematic Risks
What could shift the picture
Three risks could change the narrative regardless of how the numbers print. Each one is worth understanding before the results land.
Capex fatigue
If both Microsoft and Alphabet report in line or below expectations while reaffirming enormous spending plans, the market may start pricing the risk that AI monetisation is slower than the spending implies. That is not a stock-specific concern. It would be a broader de-rating event, affecting the valuations of companies across the technology sector.
Regulatory escalation
The FTC investigation into Microsoft, the DOJ case against Alphabet, and emerging EU scrutiny of NVIDIA's CUDA software ecosystem are all active. A material legal development before the earnings calls could overshadow the financial results entirely. Regulatory risk in this sector is not theoretical. It is live and moving.
Competition from custom silicon
Microsoft's Maia 200 chip, Alphabet's Ironwood TPU, Amazon's Trainium and Meta's custom accelerators are all reducing how much the large cloud companies depend on NVIDIA hardware. If any of these companies signals a meaningful shift in its GPU procurement plans, that could create uncertainty around NVIDIA's forward order book.
Note: These systemic risks represent thematic pivots that may influence risk appetite independently of headline EPS beats.
The Bottom Line
The 2026 reality check
Microsoft and Alphabet report on the same evening, 29 April. NVIDIA follows in late May. Together, they offer the clearest read yet on whether the AI infrastructure buildout is generating returns fast enough to justify the extraordinary scale of capital being committed.
$MSFT
AI spend is shifting from cost to competitive advantage. The question is whether margins can follow.
$GOOGL
Vertical integration from chips to search to cloud may prove to be a moat, or an expensive position to defend.
$NVDA
This is the pulse of the AI hardware cycle, and a test of whether Rubin can keep the supercycle alive into 2027.
Taken together, they offer a read on a market that looks more physical, more capital-intensive and, for many traders, more real.
Your next earnings setup starts here
Stay ahead of major beats, misses, and market surprises. Log in to your terminal, open a new account, or explore our dedicated earnings academy.
April’s US earnings season is landing in a market that wants more than a good story. As GO Markets highlighted in its recent defence earnings watchlist, this reporting period is arriving after a broader shift in what markets care about. It is no longer just about growth at any cost. Traders want to know what the numbers are saying beneath the surface.
Why these 3 names matter
In this part of the market, that brings Tesla, NextEra Energy and Exxon Mobil into focus. Each offers a different read on a key 2026 theme: autonomy, electricity demand and oil supply risk.
Tesla: Is being judged on whether autonomy and energy can support the next stage of growth
NextEra: Offers a window into rising power demand and the infrastructure needed to meet it
Exxon Mobil: Sits at the centre of the oil and energy security story as supply risks stay in focus
Taken together, these three names help explain where attention may be shifting. The question is no longer just who has the strongest narrative, rather, who can show real demand, firmer margins and execution that holds up in a more complicated backdrop.
In 2026, AI power demand is pushing utilities, storage and grid capacity into sharper focus while at the same time, oil supply risk has brought energy security back into the market conversation.
IMPORTANT: REPORTING SCHEDULES CAN CHANGE WITHOUT NOTICE. REPORTING DATES AND RELEASE TIMES ARE FROM COMPANY INVESTOR RELATIONS CALENDARS WHERE MARKED CONFIRMED; OTHERWISE THEY ARE GO MARKETS ESTIMATES. CONSENSUS EPS, REVENUE AND ANALYST-RANGE DATA ARE FROM THIRD-PARTY MARKET CONSENSUS SOURCES, AS OF 14 APRIL 2026 (AEST). COMPANY GUIDANCE, BACKLOG AND OPERATING METRICS ARE FROM THE LATEST COMPANY FILINGS OR RESULTS PRESENTATIONS UNLESS STATED OTHERWISE. FIGURES AND SCHEDULES MAY CHANGE WITHOUT NOTICE.
$TSLA| Q1 2026 REPORTING PERIOD
Tesla Inc.
NASDAQ | Consumer Discretionary | 22 Apr 2026
Confirmed
Global Release Countdown (AMC)
00:00:00:00
Consensus EPS
US$0.41
Consensus Revenue
US$22.26bn
AU/ASIA23 Apr | 6:05 am
US/LATAM22 Apr | 4:05 pm
Market Intelligence: $TSLA
Analysis: Tesla price drivers and scenarios
Auto Gross Margin
17-19%
Target floor, excl. credits
Megapack Growth
+25% YoY
Projected energy deployment
Analyst range
US$0.32-0.48
EPS estimate range
AVG
LOW US$0.32AVG US$0.41HIGH US$0.48
The US$0.16 analyst range shows there is still a lot of uncertainty. The main question is how weaker vehicle deliveries compare with stronger, higher-margin energy storage contributions. A result above US$0.48 would suggest the autonomy and battery story is improving faster than the bear case expects.
Key factors that could move the result
Automotive gross margin
This is the most important number for Tesla’s core business. Markets want to see whether price cuts have started to settle, or whether margins are still under pressure.
Benchmark: 17% (excluding credits)
Energy storage (Megapacks)
This is the more durable growth story. Strong Megapack deployment and battery margins could help offset weaker vehicle deliveries
Focus: Storage growth versus pressure in the auto business
Full Self-Driving (FSD) & Robotaxi
This is the main narrative driver. Markets will watch for updates on FSD adoption and the robotaxi timeline to judge whether the move towards “physical AI” is becoming more credible.
Watch: Timing for next-generation autonomy technology
Regulatory credits
This is a quality check on the result. If EPS is boosted too much by credit sales, some traders may see the beat as less durable.
Watch: How much credit sales contribute to final EPS
Trade Execution: $TSLA
Earnings reaction framework: Q1 2026
Bull case
EPS above US$0.45, energy margins at 20%+ | FSD take rates rising
The result clears the top-tier analyst range. Commentary focuses on FSD scaling and Megapack production ramps rather than vehicle discounting. FY26 guidance is reaffirmed.
Possible reaction: stronger momentum, with short covering adding support
Base case
EPS between US$0.38 and US$0.43, auto margins stable | Near target
The result is close to expectations, but there is no major surprise from the energy business. The market stays focused on the robotaxi timeline. The initial move may be limited if the product mix looks unchanged.
Possible reaction: range-bound trading or a muted early response
Bear case
EPS below US$0.35, auto margins drop below 16% | Signs of FSD delays
The result misses even cautious expectations. Rising inventory suggests more discounting may be needed. The market starts to question whether the level of spending on AI and autonomy is too high.
Possible reaction: rotation out of the stock, especially if growth confidence weakens
Sentiment Analysis · Tesla Inc.
Interactive scenario analysis: $TSLA
Select earnings outcome
Growth momentum
Strong result, helped by energy and FSD
FSD and Energy do better than expected, which helps offset weaker car deliveries. Management gives the market more confidence that autonomy is getting closer to real revenue. Auto margins staying above 17% would also help.
EPS Outcome
Above US$0.45
Energy Signal
On track
Margins
At or above 17%
Possible reaction
Strong rally
Sources & Data Methodology
Sources: Reporting dates and release times are from company investor relations calendars where marked Confirmed; otherwise they are GO Markets estimates. Consensus EPS, revenue and analyst-range data are sourced from Bloomberg and Earnings Whispers, as at 14 April 2026 (AEDT). Company guidance, backlog and operating metrics are sourced from the latest company filings, results presentations or investor relations materials unless stated otherwise. Any scenario analysis reflects GO Markets analysis. Figures and schedules may change without notice.
Expanded Coverage
AI isn’t the only trade this earnings season.
From data centres to defence, see why JPMorgan and the big defence players are on our radar for March.
If Tesla is the market’s test of whether physical AI can become a business, NextEra is a test of whether the power buildout behind AI is starting to show up more clearly in utility economics.
That is what makes the shift from Tesla to NextEra interesting: one is about ambition and platform narrative and the other is about power, contracts, infrastructure and return on capital.
$NEE| Q1 2026 REPORTING PERIOD
NextEra Energy, Inc.
NYSE | Utilities | 23 Apr 2026
Confirmed
Global Release Countdown (BMO)
00:00:00:00
Consensus EPS
US$0.91
Consensus Revenue
US$7.17bn
AU/ASIA23 Apr | 9:35 pm
US/LATAM23 Apr | 7:35 am
Market Intelligence: $NEE
Analysis: NEE price drivers and scenarios
Backlog
About 29.8 GW
Total Energy Resources backlog
Growth target
8%+ a year
Adjusted EPS growth through 2032
Analyst range
US$0.88-1.06
Q1 EPS estimate range
AVG
LOW US$0.88AVG US$0.92HIGH US$1.06
The main question is simple: can NextEra turn big growth plans into real progress? Traders want to see whether rising power demand, especially from AI, is starting to show up in results, contracts and project execution.
Trade Execution: $NEE
Key signals to watch
Contract conversion
One of the biggest proof points. Markets want to see whether strong customer interest is turning into signed agreements and clearer revenue visibility.
Signal: More large-load agreements signed
Natural gas and power buildout
Traders will watch for clearer milestones on the approved gas buildout and capacity plan to meet rising power demand.
Focus: Buildout timeline and project execution
Funding and capital discipline
Investors will want to know whether funding plans look manageable after the recent equity raise and the impact of financing costs.
Watch: Funding risk and capital pressure
Rate base and earnings outlook
Markets look for healthy rate-base growth and signs that rising demand can support long-term earnings growth.
Focus: Guidance, rate-base growth and EPS visibility
Sentiment Analysis · NextEra Energy
Interactive scenario analysis: $NEE
Select earnings outcome
Upside momentum
Strong result, backed by real progress
EPS comes in above US$1.06. Management shows better contract progress and clearer steps on new power projects. That would suggest the backlog is moving closer to real revenue.
EPS Outcome
Above US$1.06
Infrastructure Signal
More contracts signed
Possible reaction
Sentiment improves
Sources & Data Methodology
Sources: Reporting dates and release times are from company investor relations calendars where marked Confirmed; otherwise they are GO Markets estimates. Consensus EPS, revenue and analyst-range data are sourced from Bloomberg and Earnings Whispers, as at 14 April 2026 (AEDT). Company guidance, backlog and operating metrics are sourced from the latest company filings or results presentations. Any scenario analysis reflects GO Markets analysis. Figures and schedules may change without notice.
From power to oil
If NextEra reflects the electricity side of the real economy story, Exxon Mobil reflects the fuel side. That matters in a market where supply risk can still reset inflation expectations, shift sector leadership and change how traders think about defensiveness.
$XOM| Q1 2026 REPORTING PERIOD
Exxon Mobil Corporation
NYSE | Energy | 1 May 2026
Confirmed
Global Release Countdown (BMO)
00:00:00:00
Consensus EPS
US$1.66
Consensus Revenue
US$82.47bn
AU/ASIA1 May | 8:30 pm
US/LATAM1 May | 6:30 am
Market Intelligence: $XOM
Analysis: XOM price drivers and scenarios
Liquids pricing effect
US$1.9-2.3bn
Support from stronger oil prices
Energy products timing
-US$3.3-4.1bn
Downstream timing drag
Analyst range
US$1.60-$1.85
Q1 EPS estimate range
AVG
LOW US$1.60AVG US$1.66HIGH US$1.85
The key question for Exxon Mobil is straightforward: can stronger oil and gas pricing offset weaker volumes and downstream pressure? For traders, this is a test of earnings quality, if prices do the lifting, the market may still want proof that operations are holding up.
Trade Execution: $XOM
Key signals to watch
Realised pricing
Markets want to see whether stronger oil and gas prices were enough to offset weaker production volumes.
Signal: Price strength vs Volume pressure
Timing and quality
Commentary on whether the downstream timing drag is temporary or a sign of deeper margin pressure.
Focus: Accounting effect vs Headwind
Guyana and Upstream
Markets want steady production growth from Guyana to keep the long-term story intact.
Watch: Delivery and Resilience
Refining margins
Even if crude helps, weaker refining or chemicals performance could limit the overall upside.
Focus: Downstream offset levels
Sentiment Analysis · Exxon Mobil
Interactive scenario analysis: $XOM
Select earnings outcome
Pricing offsets disruption
Strong result, with pricing support doing enough
EPS above US$1.85. Higher realised pricing more than offsets weaker volumes, and management suggests timing drag was less severe than expected. Upstream updates stay constructive.
EPS Outcome
Above US$1.85
Timing Impact
Smaller than feared
Possible reaction
Sentiment improves
Sources & Data Methodology
Sources: Reporting dates from company investor relations calendars; otherwise they are GO Markets estimates. Consensus EPS, revenue and analyst-range data from Bloomberg and Earnings Whispers as at 14 April 2026 (AEDT). Any scenario analysis reflects GO Markets analysis. Figures and schedules may change without notice.
The Bottom Line
The 2026 Reality Check
This late-April energy cluster is about more than three company reports. It is a live test of what the market wants to pay for in 2026.
Tesla ($TSLA)
Autonomy and energy shifting from promise to proof.
NextEra ($NEE)
Electricity demand turning into practical utility growth.
Exxon ($XOM)
Oil strength translating into durable earnings power.
Taken together, they offer a useful read on the part of the market that looks more physical, more capital-intensive and, for many traders, more real.
Your next earnings setup starts here
Stay ahead of major beats, misses, and market surprises. Log in to your terminal, open a new account, or explore our dedicated earnings academy.
El anuncio del alto el fuego del 8 de abril y las discusiones paralelas en torno a una tregua de 45 días no han resuelto la interrupción del Estrecho de Ormuz. Por ahora, han puesto un tope al peor escenario posible, pero el tráfico de petroleros se mantiene en una fracción de los niveles normales y la demanda iraní de tarifas de tránsito señala un cambio estructural, no temporal.
Lo que comenzó como un conflicto regional se ha convertido en un shock energético global, y la pregunta para los mercados ya no es si Ormuz fue interrumpido, sino cómo permanentemente la interrupción cambia el piso de precios para el petróleo.
Puntos clave
Alrededor de 20 millones de barriles por día (bpd) de petróleo y productos derivados del petróleo normalmente pasan por el Estrecho de Ormuz entre Irán y Omán, lo que equivale a aproximadamente una quinta parte del consumo mundial de petróleo y aproximadamente el 30% del comercio mundial de petróleo marítimo.
Esto es un choque de flujo, no un problema de inventario. Los mercados petroleros dependen del rendimiento continuo, no del almacenamiento de información estático.
Si la interrupción persiste más allá de unas pocas semanas, el Brent podría pasar de un pico a corto plazo a un shock de precios más amplio, con riesgo de estanflación.
El tráfico de petroleros a través del estrecho cayó de alrededor de 135 barcos por día a menos de 15 en el pico de interrupción, una reducción de aproximadamente 85%, con más de 150 embarcaciones ancladas, desviadas o retrasadas.
El 8 de abril se anunció un alto el fuego de dos semanas, con negociaciones de tregua de 45 días en curso. Irán ha señalado por separado una demanda de tarifas de tránsito para los buques que utilizan el estrecho, lo que, de formalizar, representaría un piso geopolítico permanente en los costos de energía.
Los mercados han comenzado a alejarse del crecimiento y la exposición tecnológica hacia los nombres de energía y defensa, lo que refleja la opinión de que el petróleo elevado se está convirtiendo en un costo estructural en lugar de una prima de riesgo temporal.
Institutional Grade Performance
Master the Markets with MetaTrader 5
Trade hundreds of instruments with superior speed and advanced technical analysis. Harness full EA functionality to execute your strategy.
El punto de choque petrolero más crítico del mundo
El Estrecho de Ormuz maneja aproximadamente 20 millones de barriles diarios de petróleo y productos derivados del petróleo, lo que equivale a alrededor del 20% del consumo mundial de petróleo y alrededor del 30% del comercio mundial de petróleo marítimo. Con la demanda mundial de petróleo cercana a los 104 millones de bpd y la capacidad sobrante limitada, el mercado ya estaba fuertemente equilibrado antes de la última escalada.
El estrecho también es un corredor crítico para el gas natural licuado. Alrededor de 290 millones de metros cúbicos de GNL transitaron por la ruta cada día en promedio en 2024, lo que representa aproximadamente el 20% del comercio mundial de GNL, siendo los mercados asiáticos el principal destino.
La Agencia Internacional de Energía (AIE) ha descrito a Ormuz como el punto de choque del tránsito petrolero más importante del mundo, señalando que incluso las interrupciones parciales pueden desencadenar movimientos desmedidos de precios. El crudo Brent se ha movido por encima de los 100 dólares el barril, lo que refleja tanto la estanqueidad física como una prima de riesgo geopolítico al alza.
Fuente: Administración de Información Energética de Estados Unidos, de fecha 17 de junio de 2025, utilizando el promedio diario de 2024
Tanques inactivos a medida que los flujos son lentos
Los datos de envío y seguros ahora apuntan a tensión en tiempo real. Se informa que más de 85 grandes transportistas de crudo están varados en el Golfo Pérsico, mientras que más de 150 embarcaciones han sido ancladas, desviadas o retrasadas a medida que los operadores reevalúan la cobertura de seguridad y seguros. Eso dejaría un estimado de 120 millones a 150 millones de barriles de crudo inactivos en el mar.
Esos volúmenes representan solo de seis a siete días de rendimiento normal de Hormuz, o un poco más de un día de consumo mundial de petróleo.
Los datos actualizados de envío y seguros confirman ahora que más de 150 embarcaciones han sido ancladas, desviadas o retrasadas, por encima de las 85 reportadas inicialmente. Los 1.3 días de cobertura de consumo mundial del crudo inactivo siguen siendo la limitación vinculante: se trata de un shock de flujo, no un problema de almacenamiento, y el alto el fuego aún no se ha traducido en un rendimiento restaurado de manera significativa.
🌋 Trump, volatility and Hormuz.
As tariff shocks collide with a ten year extreme in oil positioning, the margin for error is zero. See the technical markers and safe haven pivots defining the current risk environment.
Un mercado basado en el flujo, no en el almacenamiento de información
Los mercados petroleros funcionan en movimiento continuo. Las refinerías, las plantas petroquímicas y las cadenas de suministro mundiales están calibradas para lograr entregas estables a lo largo de rutas marítimas predecibles. Cuando los flujos a través de un punto de choque que lleva aproximadamente una quinta parte del consumo mundial de petróleo y alrededor del 30% del comercio mundial de petróleo marítimo se interrumpen, el sistema puede pasar del equilibrio al déficit en cuestión de días.
La capacidad de producción sobrante, concentrada en gran medida dentro de la OPEP, se estima en sólo 3 millones a 5 millones de bpd. Eso queda muy por debajo de los volúmenes en riesgo si los flujos de Ormuz se ven gravemente perturbados.
GO Markets — Idle Tankers: Days of Cover
Oil market analysis
How long do idle tankers last?
135M idle barrels — days of cover against each demand benchmark
vs. Strait of Hormuz daily flow (20M bbl/day)
6.75 daysof Hormuz throughput covered
6.75 days
0
5
10
15
20
25
30 days
vs. Global oil consumption (104M bbl/day)
1.3 daysof world demand covered
1.3 days
0
5
10
15
20
25
30 days
vs. US Strategic Petroleum Reserve release (1M bbl/day)
135 daysof full SPR release pace covered
135 days — but SPR exists to replace this role
0
5
10
15
20
25
30 days
135M
idle barrels on tankers (midpoint of 120–150M range)
~33%
of daily Hormuz flow that is idle storage, not transit
<31 hrs
is all idle storage against global daily consumption
Indicative market trajectories based on disruption severity
Scenarios for the weeks ahead
1–2 WEEKS
Ceasefire catch-up
Markets face catch-up repricing. Brent could consolidate in the US$105–US$115 range as risk premia unwind. Brent may trade lower (US$95–US$110) if strategic stocks bridge the temporary shortfall.
2–4 WEEKS
Infrastructure blitz
Shifts to structural supply shock. Brent moving toward US$150–US$200 cannot be ruled out. This is the stagflation trigger where energy costs constrain central bank flexibility.
STRUCTURAL
Geopolitical floor
Iran's transit fee demand creates a permanent input cost. The pre-crisis price structure (US$60–US$70) may not return, embedded in insurance and freight rates.
Critical Threshold
US$120 remains the level at which energy inflation becomes a direct Federal Reserve policy problem.
Riesgos de inflación y macroderrames
El impacto inflacionario de un choque petrolero suele llegar en oleadas. Los precios más altos del combustible y la energía pueden elevar rápidamente la inflación general a medida que los costos de gasolina, diésel y energía se muevan al alza.
Con el tiempo, los mayores costos de energía pueden pasar por fletes, alimentos, manufactura y servicios. Si la perturbación persiste, la combinación de una inflación elevada y un crecimiento más lento podría elevar el riesgo de un entorno estanflacionario y dejar a los bancos centrales enfrentando una difícil compensación.
🛢️ Brent hits $100.
Exxon and SLB are leading the rotation out of tech. Get the price targets and technical support levels for the top 5 energy majors.
Sin compensación fácil, un sistema con poca holgura
Lo que hace que el episodio actual sea particularmente agudo es la falta de holgura en el sistema global.
La oferta y la demanda mundiales cerca de 103 millones a 104 millones de bpd dejan poco colchón de sobra cuando un punto de choque que maneja casi 20 millones de bpd, o cerca de una quinta parte del consumo mundial de petróleo, se ve comprometido. La capacidad sobrante estimada de 3 millones a 5 millones de bpd, en su mayoría dentro de la OPEP, cubriría sólo una fracción de los volúmenes en riesgo.
Las rutas alternativas, incluidas las tuberías que eluden Ormuz y el envío reencaminado, solo pueden compensar parcialmente los flujos perdidos, y generalmente a un costo más alto y con plazos de entrega más largos.
Conclusión
Hasta que se restablezca el tránsito por el Estrecho de Ormuz y se vea como creíblemente seguro, es probable que los flujos mundiales de petróleo sigan deteriorados y las primas de riesgo sean elevadas. Para los inversionistas, los formuladores de políticas y los tomadores de decisiones corporativas, la pregunta central es si el petróleo puede moverse hacia donde necesita ir, todos los días, sin interrupción.
Market Opportunity
Don't just watch the squeeze. Trade the framework.
As positioning gaps hit decade extremes, access advanced charting tools and real time execution on the six key markets defining this cycle.


.jpeg)

