
Noticias del mercado & perspectivas
Anticípate a los mercados con perspectivas de expertos, noticias y análisis técnico para guiar tus decisiones de trading.

April's US earnings season is landing in a market that wants more than a good story. JPMorgan has already set a high bar with a strong result, and attention is now shifting to the engine room of the S&P 500: AI infrastructure where three companies are at the centre of that story.
Why this earnings window matters for AI
Microsoft, Alphabet and NVIDIA are not just participants in the AI cycle, they are building the physical and software architecture that other companies depend on: the chips, the cloud regions, the models and the tools. If this spending is going to deliver returns, the first signs may start to show in their quarterly results over the next few weeks.
Each company represents a different test.
- Microsoft: Whether enterprise AI adoption is translating into revenue and margin expansion
- Alphabet: Whether owning the full stack, from chips to cloud to distribution, is a durable advantage or simply an expensive position to defend
- NVIDIA: Whether the hardware cycle is still holding, accelerating or starting to level out
In 2026, the question is no longer whether AI investment is happening, the capital commitments are substantial and already publicly stated. The question is whether that spending is generating returns quickly enough to justify the scale of those bets.


USD was mildly bid on Monday ahead of a very busy calendar starting with US CPI later today. The US Dollar Index (DXY) rose to a high of 104.26, testing its trendline resistance before paring back to finish the session modestly in the green. DXY continuing to trade in the tight range between its 200-Day MA to the downside and resistance at around 104.25 to the upside.
USD traders have a busy week ahead, along with CPI today, PPI and the FOMC rate announcement are ahead tomorrow. The Japanese Yen dumped after a Bloomberg report citing BoJ sources that said the BoJ sees little need to end negative rates in their December meeting. This saw rates markets rapidly reprice what was a 20% chance of a rate hike, down to just 5%.
This translated to a short squeeze on USDJPY as carry traders flooded back in and saw the pair rally to a high of 146.46. Gold saw another large decline, with XAUUSD dropping almost $30 USD an ounce, breaking through the psychological 2000 level and hitting 3-week lows. XAUUSD now sitting on its 50% Fib retracement support, with the next support lower around the 1950-52 level at the 200-day MA and 61.8 fib level.
Ahead today, the real data starts, headlining will be US CPI where the Y/Y figure is expected to moderate to 3.1% vs 3.2% previous.
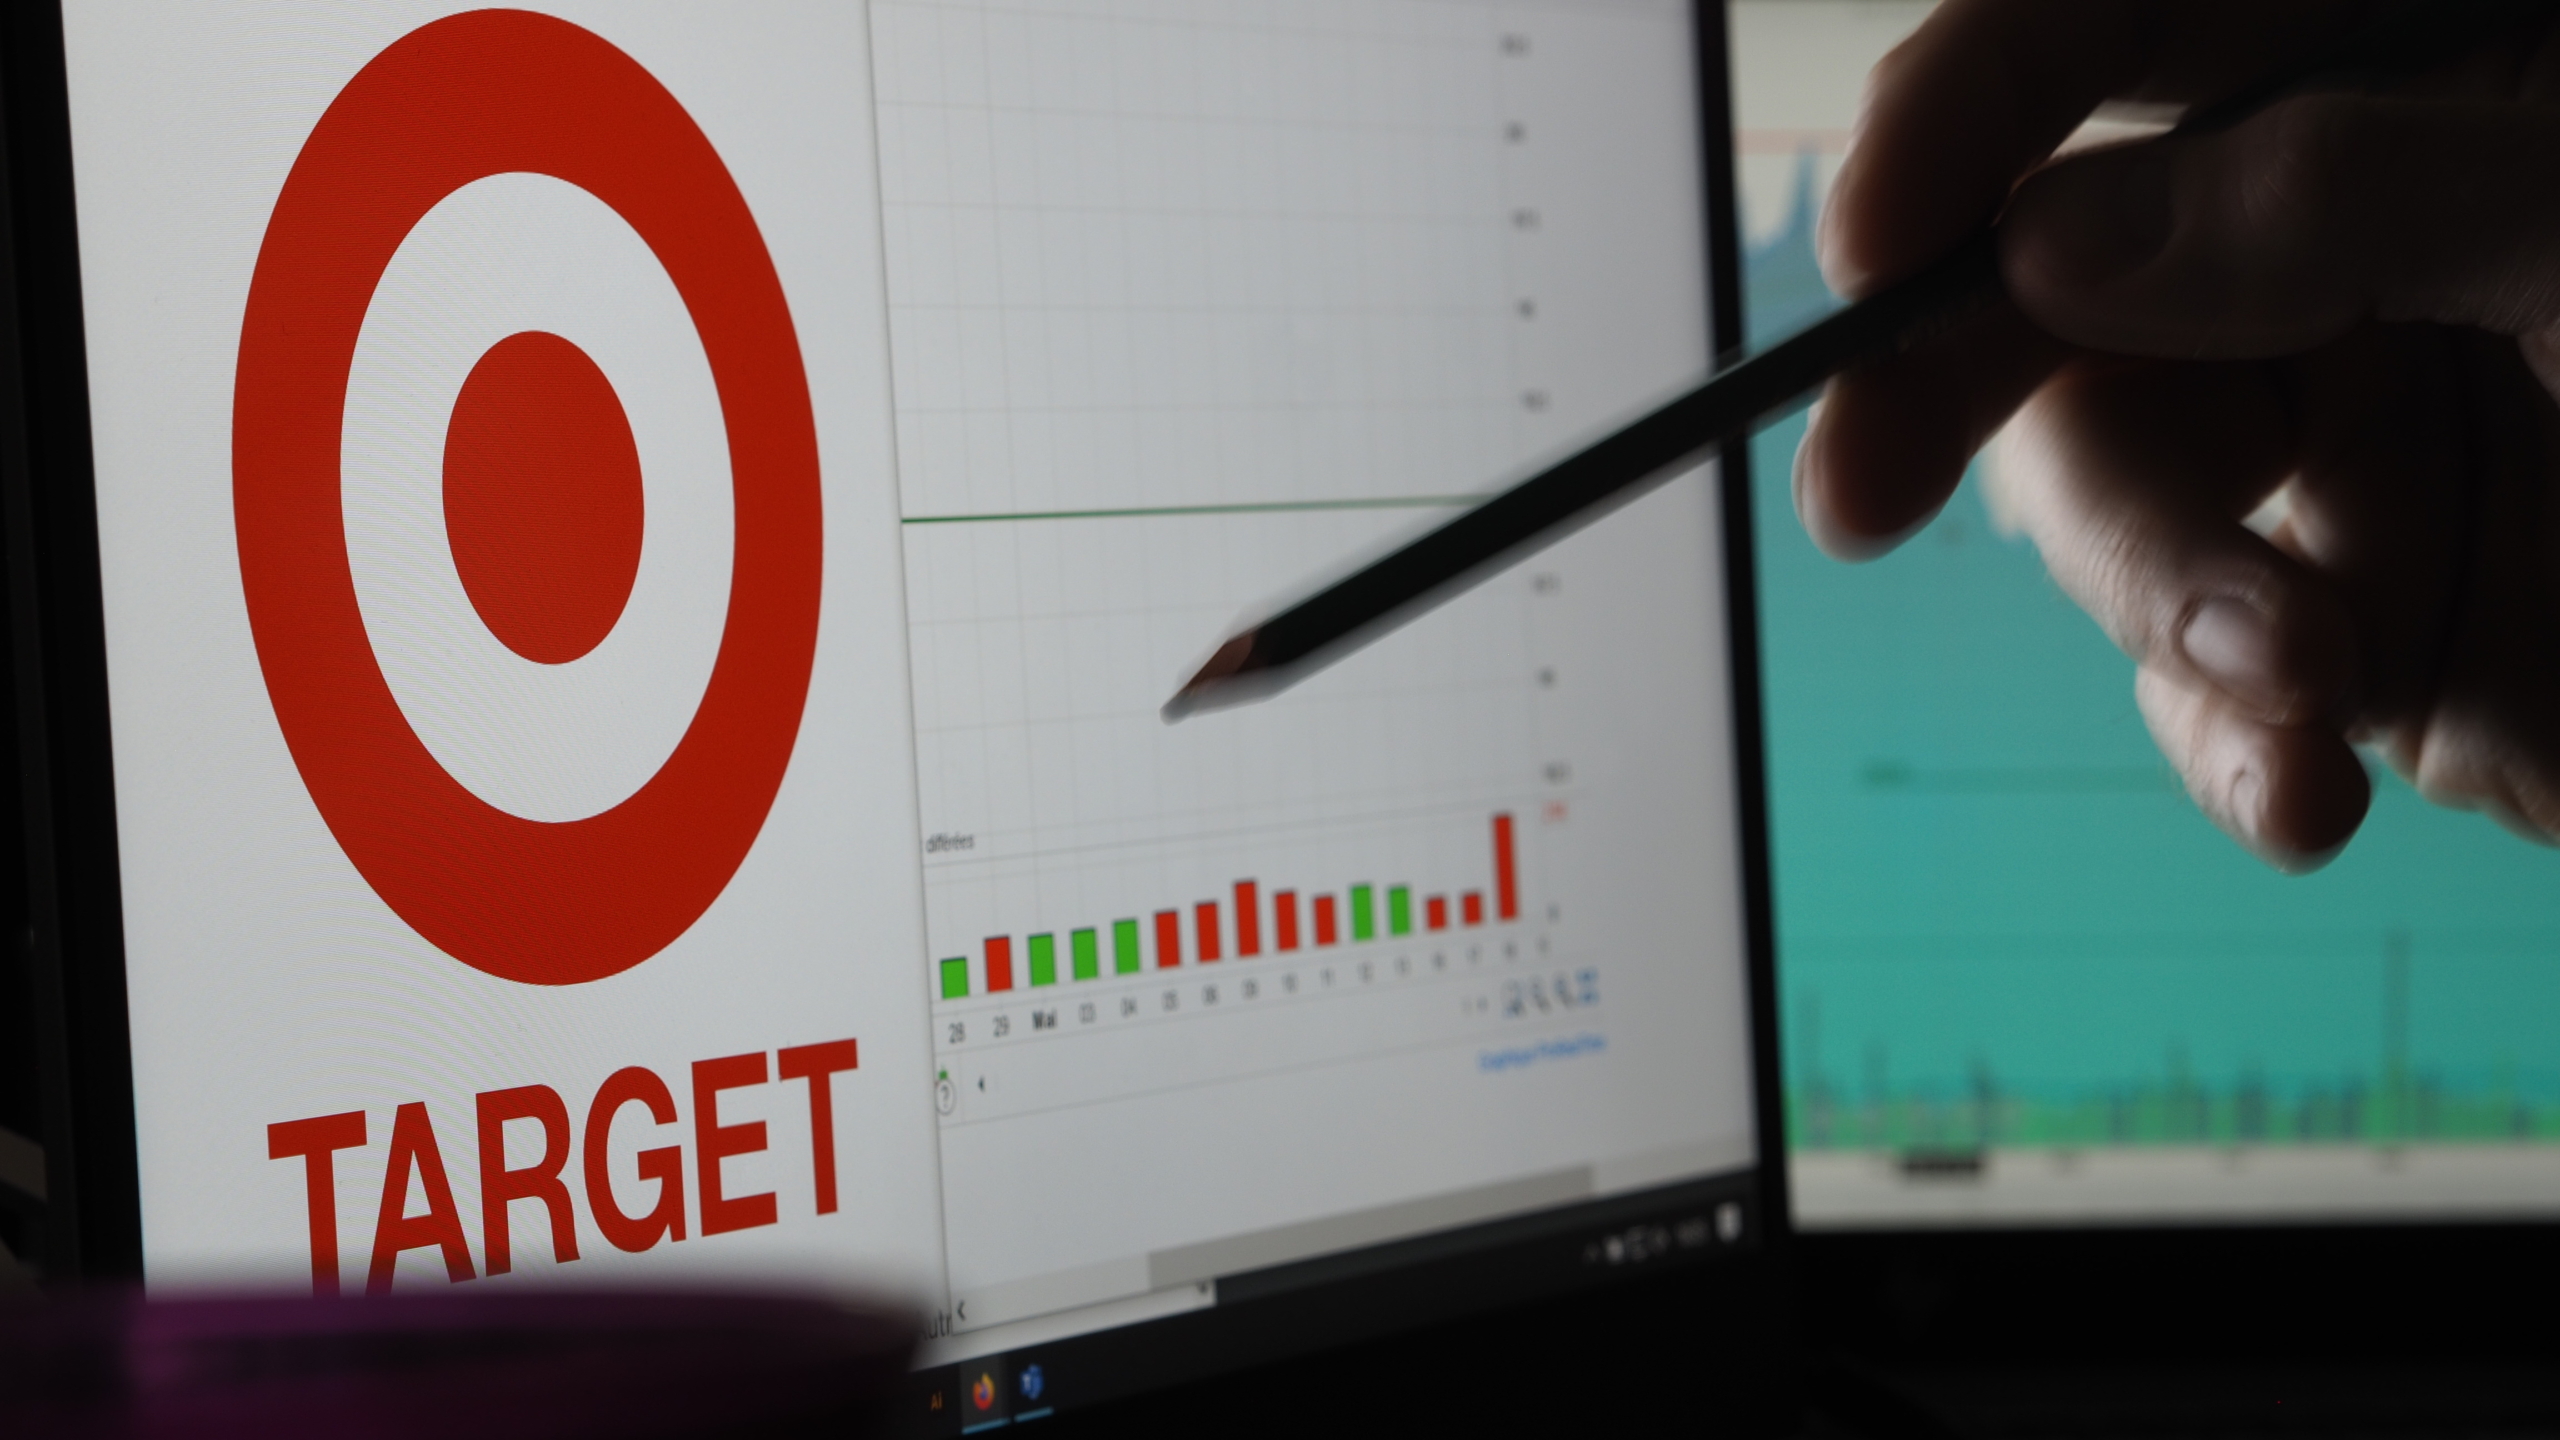
Target Corporation (NYSE: TGT) released Q3 financial results before the market open in the US on Wednesday. The US retail giant beat both revenue and earnings per share (EPS) estimates for the previous quarter, sending the stock higher. Company overview Founded: June 24, 1902 Headquarters: Target Plaza Minneapolis, Minnesota, United States Number of employees: 440,000 (2023) Industry: Retail Key people: Brian Cornell (Chairman & CEO) The results Target reported revenue of $25.398 billion for Q3 (down by 4.2% from the same period in 2022) vs. $25.285 billion estimate, according to TradingView.
EPS reported at $2.10 per share (up by 35.9% year-over-year), exceeding analyst estimate of $1.474 per share. CEO commentary "In the third quarter, our team continued to successfully navigate our business through a very challenging external environment. While third quarter sales were consistent with our expectations, earnings per share came in far ahead of our forecast.
This profit performance benefited from our team's commitment to efficiency and disciplined inventory management, and I'd like to thank them for their tireless efforts. Looking ahead, we're continuing to make investments throughout our business -- in our assortment, our team and the services we offer -- to provide the newness, affordability and convenience our guests want during the holiday season and beyond," company CEO, Brian Cornell commented on the latest results and future plans. The stock was up by over 16% after posting better-than-expected results.
Shares were trading at around $129.55 – the highest level since 18/8/2023. Stock performance 1 month: +17.13% 3 months: +0.26% Year-to-date: -13.39% 1 year: -16.97% Target price targets Jefferies: $135 Telsey Advisory Group: $145 Tigress Financial: $180 Evercore ISI Group: $130 B of A Securities: $135 Truist Securities: $116 Stifel: $130 HSBC: $140 Morgan Stanley: $140 Target Corporation is the 270th largest company in the world with a market cap of $59.61 billion, according to CompaniesMarketCap. You can trade Target Corporation (NYSE: TGT) and many other stocks from the NYSE, NASDAQ, HKEX, ASX, LSE and DE with GO Markets as a Share CFD.
GO Markets now offers pre-market and after-market trading on popular US Share CFDs. Trade the pre-market session: 4:00am to 9:30am, normal session, and after-market session: 4:00pm to 8:00pm, Eastern Standard Time. Why trade during extended hours?
Volatility never sleeps. Trade over earnings releases as they happen outside of main trading hours Reduce your risk and hedge your existing positions ahead of a new trading day Extended trading hours on popular US stocks means extended opportunities Sources: Target Corporation, TradingView, MarketWatch, MetaTrader 5, CompaniesMarketCap, Wikipedia

Home Depot Inc. (NYSE: HD) released its latest financial results before the opening bell in the US on Tuesday, beating analyst estimates for the third quarter. Company overview Founded: February 6, 1978 Headquarters: Atlanta, Georgia, United States Number of employees: 471,600 (2023) Industry: Retail Key people: Ted Decker (President & CEO), Craig Menear (Chairman) The results The US retailer reported revenue of $37.71 billion (down by 3% year-over-year) for Q3 vs. $37.591 billion expected. Earnings per share (EPS) reported at $3.81 per share (down by 10.14% year-over-year), above $3.755 per share estimate.
CEO commentary "Our quarterly performance was in line with our expectations," Ted Decker, CEO of Home Depot said in a press release to investors. "Similar to the second quarter, we saw continued customer engagement with smaller projects, and experienced pressure in certain big-ticket, discretionary categories. We remain very excited about our strategic initiatives and are committed to investing in the business to deliver the best interconnected shopping experience, capture wallet share with the Pro, and grow our store footprint. In addition, our associates did an outstanding job delivering value and service for our customers throughout the quarter and I would like to thank them for their dedication and hard work," Decker added.
Shares of Home Depot rose by over 6% on Tuesday after the latest earnings results. The stock was trading at $307.06 a share – the highest level since 25/9/2023. Stock performance 1 month: +3.58% 3 months: -7.71% Year-to-date: -2.95% 1 year: -1.73% Home Depot price targets Stifel: $306 RBC Capital: $303 Truist Securities: $341 HSBC: $365 Jefferies: $384 Morgan Stanley: $350 Wedbush: $350 Wells Fargo: $360 Barclays: $333 JP Morgan: $335 Goldman Sachs: $350 Home Depot Inc. is the 26th largest company in the world with a market cap of $307 billion, according to CompaniesMarketCap.
You can trade Home Depot Inc. (NYSE: HD) and many other stocks from the NYSE, NASDAQ, HKEX, ASX, LSE and DE with GO Markets as a Share CFD. GO Markets now offers pre-market and after-market trading on popular US Share CFDs. Trade the pre-market session: 4:00am to 9:30am, normal session, and after-market session: 4:00pm to 8:00pm, Eastern Standard Time.
Why trade during extended hours? Volatility never sleeps. Trade over earnings releases as they happen outside of main trading hours Reduce your risk and hedge your existing positions ahead of a new trading day Extended trading hours on popular US stocks means extended opportunities Sources: Home Depot Inc., TradingView, MarketWatch, CompaniesMarketCap, Wikipedia, Benzinga, Stock Analysis
USD rallied strongly in Thursday’s session after a quiet start following dismal demand for US 30 year-treasuries at a scheduled bond auction, seeing yields surge and taking the USD with them. The push higher was later given an extra boost by Fed Chair Powell’s hawkish statements during a panel organized by the IMF. In a scheduled panel chat the FOMC head said that “policymakers are not confident that they have achieved a sufficiently restrictive stance to return inflation to the 2.0% target in a sustained manner.” That was enough to see the USD bulls take charge with DXY up 0.4% for the day, while yields also spiked, this saw some volatility in USD cross pairs and gold we’ll look at the highlights in the charts below.
USDJPY TECHNICAL ANALYSIS USDJPY pulled back last week after the BoJ tweak to their YCC saw Japanese bond yields rise, giving the Yen a boost. However, as has been the case with this pair in the last 12 months the uptrend quickly resumed, with USDJPY breaking back above the key 151 level and heading towards its 2022 and 2023 high of 151.72. At these levels there is always the threat of a BoJ currency intervention, so traders will need to keep an ear out for any jawboning from BoJ members telegraphing such a move.
If the BoJ steps aside a test of the upper trend line at 154 could be a possibility. If they do step in we could see a decline to a 146 handle and lower trendline before finding any technical support. GOLD TECHNICAL ANALYSIS Gold has reversed lower this week after the upward momentum failed at the key 2010 resistance level.
Risk premium priced into gold also started to unwind after gaza conflict haven flows pushed the price rapidly higher from early October. Thursday session did see a modest bounce, despite a rampant USD which could give the bulls some hope, however the 23.6 Fib level, which acted as short-term support on the way down now seems to have switched to resistance. This will be the level on the upside to watch (1963.78), the next resistance from a technical point of view will be the 2010 level.
To the downside the 38.2 Fib at 1934.79, which also matches up with the 200 day SMA looks to be the first real support level.
AUDUSD dropped in Tuesday’s session with AUD being weighed on post-RBA decision, as the less hawkish RBA guidance outweighed the widely anticipated 25bps hike to 4.35%. Though the market reaction was a little curious given the small changes to the accompanying statement hardly made it dovish. The RBA changed its forward guidance to say "whether further tightening of monetary policy is required...will depend upon the data" from the previous “Some further tightening of monetary policy may be required".
The push lower was also exacerbated by based weakness in the commodity space after a miss in Chinese trade data. Looking at the chart for trading opportunities we can see AUDUSD is trading in a defined range with major resistance at the 0.6500 level and major support at 0.6300 which opens up range trading opportunities with defined stop losses above or below these key levels, another key level is 0.6400 being the mid-price of the range and a level that price has chopped around recently. I think we are likely to see a bit more weakness in AUD on the back of the RBA and risk premiums coming out of gold and oil putting pressure on those commodities.
USDJPY continues to drift higher above the key 150 level into past intervention territory after the dip last week after the BoJ tweaked their YCC to extend the band, allowing Japanese yields to move higher and giving support the Yen. The drop in US yields over the past week and the modest gains in Japanese yields has seen the US 10-year / Japanese 10-year rate differential fall steeply, this rate differential has been a key driver of the USDJPY rate. However, as seen on the chart below USDJPY is remaining stubbornly high despite this, with a decent gap opening up between the rate differential and USDJPY rate.
Whether this gap “fills” i.e. a drop in USDJPY to reflect this rate differential is the question, going from the recent past it would look likely unless we see another leg higher in US yields. For Yen traders the October BoJ SOO released on Thursday will be the next decent data point to keep an eye on.

AUDUSD AUD saw gains to come within a whisker of the key 0.64 level, after hawkish leaning commentary from RBA Assistant Governor Kohler, who noted the decline in inflation is more gradual than previously thought. The Aussie also helped by a weaker USD and improved risk sentiment. The 0.64 level will be key in the near term as the mid-point of AUDUSD 3-month trading range is likely to act as resistance and support and will dictate which side of the range AUDUSD will be testing next.
USDJPY USDJPY rose to fresh peaks of 151.92 before a sharp move lower in the cross was observed without any clear catalyst which of course generated suspicions of intervention, especially given the move happened around 10am EDT, where intervention has occurred before. Also adding to the intervention narrative was comments from Japanese Finance Minister Suzuki during the Asian session where he spoke of “undesirable moves in the FX market”. USDJPY fell sharply from 151.92 to 151.19 but did retrace back to 151.70 after the dust settled, if this was a BoJ intervention it seems the 152 level may be the line in the sand and one to watch closely for Yen traders.
XAUUSD Gold rallied on Monday, recouping around half of Fridays losses after finding support at its the Oct lows to highs 38.2 fib retracement level which also matches up with the 200-day SMA. A weaker USD and falling yields also giving gold a boost along with residual safe haven demand.