
Notícias de mercado & insights
Mantenha-se à frente dos mercados com insights de especialistas, notícias e análise técnica para orientar suas decisões de negociação.

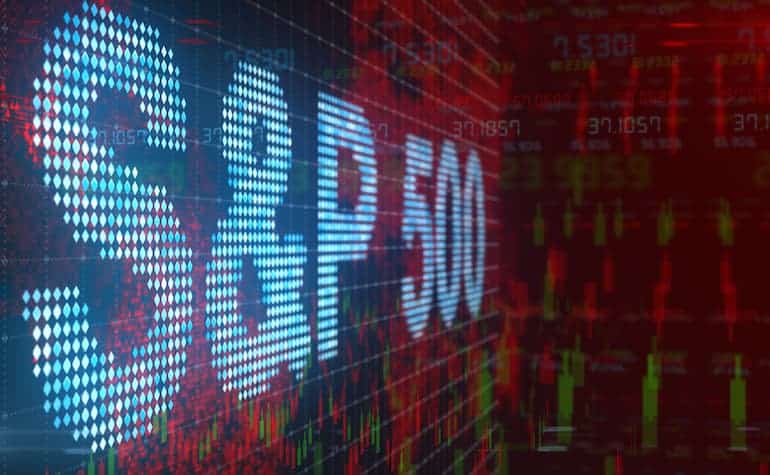
A temporada de resultados de abril nos EUA está chegando a um mercado que quer mais do que uma boa história. JPMorgan já estabeleceu um alto padrão com um resultado forte, e a atenção agora está se voltando para a sala de máquinas do S&P 500: infraestrutura de IA, na qual três empresas estão no centro dessa história.
Por que essa janela de ganhos é importante para a IA
Microsoft, Alphabet e NVIDIA não são apenas participantes do ciclo de IA, elas estão construindo a arquitetura física e de software da qual outras empresas dependem: os chips, as regiões da nuvem, os modelos e as ferramentas. Se esses gastos gerarem retornos, os primeiros sinais podem começar a aparecer em seus resultados trimestrais nas próximas semanas.
Cada empresa representa um teste diferente.
- Microsoft: Se a adoção da IA corporativa está se traduzindo em expansão de receita e margem
- Alfabeto: Se possuir a pilha completa, de chips à nuvem e distribuição, é uma vantagem duradoura ou simplesmente uma posição cara a ser defendida
- NVIDIA: Se o ciclo de hardware ainda está se mantendo, acelerando ou começando a se estabilizar
Em 2026, a questão não é mais se o investimento em IA está acontecendo, os compromissos de capital são substanciais e já declarados publicamente. A questão é se esses gastos estão gerando retornos com rapidez suficiente para justificar a escala dessas apostas.

Todays RBA policy meeting is expected by most analysts to result in a 50bp hike as the bank tries to play catch up and get on top of elevated inflation figures. The slightly lower Q2 CPI figures released last week has seen futures markets price out what was earlier feared could be a 75bp supersized move, a 50bp hike would see the bank able to respond further in September should the Wage price index data due on 17 August show an alarming increase in wage costs. A 50bp hike today will bring the cash rate up to 1.85% which means we would be looking at least a further 65bp of hikes coming to bring the cash rate to the neutral level of 2.5% indicated by RBA governor Lowe at the last RBA policy meeting.
Currently August rate futures are trading at an implied yield of 1.76%, pricing in a rise of 41bp which indicates traders are giving around an 80% chance of a 50bp hike. Bond traders are rarely wrong when this much is priced in so I expect a 50bp move today with the accompanying statement giving clues to Septembers meeting where it’s looking so far as a toss up between 25 or 50bp. Expected AUD reaction If a 50bp hike is announced, the most likely course in the short term for the AUD will be an initial spike up due to the markets only pricing in 80%, then volatility as the algos read the statement, and more volatility as humans get through it.
Followed by a sustained move in either direction depending on how markets re-price after digesting what the RBA has released. Keep an eye on our Twitter page for instant reaction to the RBA announcement Also please join us on our live webinar of the RBA meeting and market reaction, register at the link below RBA Live Webinar
PayPal Holding Inc. (PYPL) announced its latest financial results after the closing bell in the US on Tuesday. The US financial technology company reported revenue of $6.8 billion in Q2, topping Wall Street estimate of $6.778 billion. Earnings per share also beat analyst estimates for the quarter at $0.93 per share vs. $0.87 per share estimate. ''Our second quarter results were solid with currency neutral revenue and non-GAAP earnings growth exceeding expectations.
We continue to gain share as we execute across our key strategic initiatives, even as we drive operational efficiency across our business.'' Dan Schulman, President and CEO of PayPal said in a press release after the latest results. PayPal Holding Inc. (PYPL) chart Shares of PayPal were up by 1.20% at the close of trading on Tuesday $89.63. The stock rose by around 11% after better than expected Q2 results.
Here is how the stock has performed in the past year: 1 Month +20.47% 3 Month -1.19% Year-to-date -52.47% 1 Year -67.23% PayPal price targets Berenberg $145 Oppenheimer $101 Keybanc $100 Wells Fargo $97 JP Morgan $112 JMP Securities $100 RBC Capital $92 Piper Sandler $93 Truist Securities $80 Credit Suisse $95 Morgan Stanley $129 PayPal is the 118 th largest company in the world with a market cap of $103.79 billion. You can trade PayPal Holding Inc. (PYPL) and many other stocks from the NYSE, NASDAQ, HKEX and the ASX with GO Markets as a Share CFD. Sources: PayPal Holding Inc., TradingView, MetaTrader 5, Benzinga, CompaniesMarketCap
Pfizer Inc. (PFE) reported its Q2 financial results before the market open in the US on Thursday. World’s third largest pharmaceutical company topped both revenue and earnings per share estimates for the quarter. The company reported revenue of $27.742 billion in Q2 (up 47% year-over-year) vs. $25.487 billion expected.
Earnings per share reported at $2.04 per share (up by 92% year-over-year) vs. $1.72 per share estimate. Dr. Albert Bourla, Chairman and CEO commented on the latest results: ''In multiple meaningful ways, we made significant progress this quarter on our strategies to bring value to our patients and shareholders, while also making commitments to prioritize the broader needs of the world, including those of the environment and our most vulnerable populations.
For example, we set an ambitious goal for ourselves to achieve the Net-Zero Standard for greenhouse gas emissions by 2040, ten years ahead of the timeline described in the standard. We also launched an initiative to help bring all of our current and future patented medicines and vaccines to the 1.2 billion people living in 45 lower-income countries around the world at not-for-profit prices, a first in the industry.'' ''Even while launching these initiatives to support a healthier, more equitable world, we remain equally committed to strong financial execution on behalf of our shareholders. In the second quarter, we recorded the largest amount of quarterly sales in our history.
We also presented potentially best-in-class data for etrasimod and announced the proposed strategic acquisition of Biohaven, both of which are closely tied to our purpose: Breakthroughs that change patients’ lives,'' Dr. Bourla concluded. Pfizer Inc. (PFE) chart Despite beating Wall Street expectations for Q2, shares of Pfizer were down by around 1% at $50.98 per share.
Here is how the stock has performed in the past year: 1 Month -2.82% 3 Month +0.87% Year-to-date -13.72% 1 Year +19.07% Pfizer price targets Morgan Stanley $49 Wells Fargo $55 Citigroup $57 B of A Securities $70 Goldman Sachs $51 Pfizer Inc. is the 27 th largest company in the world with a market cap of $285.76 billion. You can trade Pfizer Inc. (PFE) and many other stocks from the NYSE, NASDAQ, HKEX and the ASX with GO Markets as a Share CFD. Sources: Pfizer Inc., TradingView, MetaTrader 5, Benzinga, CompaniesMarketCap

Is it time to Capitalise on Short Squeezes ? Short Squeezes are one of the interesting price action patterns that can occur in the market. They can provide It can provide explosive momentum trading opportunities that can go on for days.
They can provide trading opportunities for scalpers, intraday, and swing traders. What actually is a short squeeze and why do they occur? To understand a short squeeze it is important to go back to the basics of trading and understand what an actual short is and why market participants go short on a product.
What is a short? A short is a position that a market participant takes when they expect the price of a market product to go down. This can include but is not excluded too, Securities, Commodities and Forex.
A trader may take a short position because they believe a company is overvalued, a currency will go down in value due to economic factors, to hedge or for a number of other reasons. Short positions can be taken in a range of ways, however, the most common method for shorting a CFD is quite simple. It involves borrowing units to sell with the short holder having to buy-back the units at a lower price and pocketing the difference.
Example A trader believes that company ABC is overvalued at $1.00 and decides to borrow 100 CFD units of ABC to short at $1.00 per CFD with a total value of $100. The price then falls to $0.50. The trader closes their position and buys back the CFDs at $50.
They are then able to pocket the difference of $50.00. The mechanics of a short squeeze. Due to the nature of a short position which requires a buying back of the stock to both close the position and lock in profit a trader will inevitably have to buy-back or close their position at some point.
This subsequently drives up the price. Most of the time in a trending market this process works without any issues. However, if the price stops falling and consolidates or to a stage where the market starts to see value in the price again, large short holders may decide to close out their position.
If big positions or institutions close all at once it can create an avalanche effect. Indicators of a short squeeze A stock, currency, or commodity that is highly shorted or is overextended to the sell side is often ripe for a squeeze. In addition, if the underlying asset is getting closer to an area of support or resistance it may show that the selling has dried up.
Shorters may then need to close their positions soon otherwise they risk holding losing positions If a stock is bottoming or basing it may indicate that buyers are beginning to take control of the price again. This shows that the asset has reached a point where it really can’t fall any further in price because buyers see too much value. A shift in the relative volume can indicate that either a big position is closing or buyers have found an area of value and that the price might be ready to reverse.
The large volume can also indicate that an institution is playing an active role in the price. It is usually good practice to follow where the big money is when trading. Squeezing in the current market A short squeeze can represent a great opportunity to profit for traders.
They can often be explosive moves and last for days. This means that whether you are a swing trader, day trader, or a scalper anyone can capitalise on a squeeze. In addition, with the current state of the market having one of its worst first half of the years in history, with bearish sentiment being very high.
The Nasdaq in particular and growth stocks in particular have seen their value smashed. As big short positions have been taken at some stage they will have to be closed and if the market can rally, then this phenomenon may become more regular. For instance the company ZIP a strong player in the Buy Now Player Sector had seen its share priced reduced to a fraction of its peak prior to just a few weeks ago.
However as seen in the chart below, a shift in volume was the first signal that the stock was about squeeze and shift strongly to the upside. In this instance, ZIP on the weekly chart saw a massive jump in volume, followed by an even larger jump in volume the following week. Importantly ZIP, according to (Shortman.com.au) had a short % of 7.34 on July 1 2022, prior to the breakout.
Looking at the daily chart underneath, the sheer volume of buying continued to get larger and larger which is indictive of a short squeeze as large positions began to close. The subsequent price action provided great consistent buying opportunities for traders.
Meta Platforms (META) announced its Q2 financial results after the closing bell in the US on Wednesday. The social media giant fell short of analyst expectations for the quarter. Revenue reported at $28.822 billion in Q2 (down by 1% year-over-year), vs. analyst estimate of $28.908 billion.
Earnings per share at $2.46 per share (down by 32% year-over-year) vs. $2.54 per share expected. "It was good to see positive trajectory on our engagement trends this quarter coming from products like Reels and our investments in AI," Mark Zuckerberg, Meta founder and CEO said in a press release following the announcement of the latest results. "We're putting increased energy and focus around our key company priorities that unlock both near and long term opportunities for Meta and the people and businesses that use our services," Zuckerberg added. Q3 2022 projections David Wehner, CFO of Meta: "We expect third quarter 2022 total revenue to be in the range of $26-28.5 billion. This outlook reflects a continuation of the weak advertising demand environment we experienced throughout the second quarter, which we believe is being driven by broader macroeconomic uncertainty.
We also anticipate third quarter Reality Labs revenue to be lower than second quarter revenue. Our guidance assumes foreign currency will be an approximately 6% headwind to year-over-year total revenue growth in the third quarter, based on current exchange rates." Meta Platforms (META) chart* *Meta Platforms (META) is displayed as Facebook Inc. (FB) on the GO Markets MetaTrader 5 platform Share price of Meta was up by 6.55% at the closing bell on Wednesday, trading at $169.32 per share. The stock fell by around 3% in the after-hours trading.
Here is how the stock has performed in the past year: 1 Month +1.76% 3 Month -4.64% Year-to-date -50.40% 1 Year -55.31% Meta Platforms price targets Keybanc $190 Mizuho $250 Rosenblatt $181 Deutsche Bank $235 Morgan Stanley $280 Credit Suisse $245 Citigroup $270 Cowen & Co. 275 Meta Platforms is the 11 th largest company in the world with a market cap of $451.42 billion. You can trade Meta Platforms (META) and many other stocks from the NYSE, NASDAQ, HKEX and the ASX with GO Markets as a Share CFD. Sources: Meta Platforms, TradingView, MetaTrader 5, Benzinga, CompaniesMarketCap
The S&P 500 has been battered and bruised in one of the worst first half of the years in history. However, there are some signs that it may be turning. A short term long buying opportunity on the SPY looks to be apparent.
With the recent bullish sentiment due to the market believing that much of the forecast slowing growth and interest rate hikes have been prices into the market already. The trading opportunity is a technical breakout of a wedge pattern on the daily chart. Firstly it is important to recognise that the S&P500 is still in a longer term down trend.
This can be seen on the chart below. Since December 2021 the SPX has been in a downward channel making a series of lower highs and lower lows. Therefore it is important to understand that this opportunity will be against the longer general trend of the market.
The Chart On the chart the wedge at the bottom of the channel has broken to the upside. Without this break it could’ve been possible that this would've formed into a bear flag. However on the contrary, it looks to have developed into a reversal pattern, as the price has coiled.
Furthermore, and importantly, the price has broken above the 50 day average. This is also supported by the MACD. The MACD is not just showing a crossover.
To add support to the reversal, the MACD is showing a double bottom pattern of exhaustion as it looks to break over the zero line for the first time since April. A conservative target would be the convergence of the next level of resistance and also the top line of the channel. This is a 4100 target.
If the index can break through 4100 level and continue to rise to 4230. As stated previously the second move up will likely face a large amount of resistance as it is fighting the general trend and against a fairly strong resistance point.