
市场资讯及洞察

4 月的美股财报季正降临在一个“不再满足于听故事”的市场。摩根大通 (JPMorgan) 已经以强劲的业绩拉高了门槛,现在的焦点正转向标普 500 指数的“动力室”:处于 AI 基础设施叙事核心的三家巨头。
为什么这一财报窗口对 AI 至关重要
微软、Alphabet 和英伟达不仅是 AI 周期的参与者,它们更是在构建其他企业所依赖的物理与软件架构:包括芯片、云区域、模型及工具。如果这些巨额支出注定要产生回报,那么第一波迹象理应在未来几周的季度业绩中开始显现。
每家公司都代表着一次不同的考验:
- 微软 (Microsoft): 检验企业级 AI 的采用是否正在转化为实际的营收增长和利润率扩张。
- Alphabet: 检验从芯片、云端到分发渠道的“全栈模式”,究竟是持久的竞争优势,还是仅仅一个代价高昂的防御头寸。
- 英伟达 (NVIDIA): 检验硬件周期是否依然保持强势、正在加速,还是已经开始进入平稳期。
在 2026 年,问题已不再是“AI 投资是否在发生”——资本承诺已经数额巨大且已完全公开。核心问题在于,这些支出产生回报的速度,是否快到足以证明这些豪赌的规模是合理的。


热门话题
大家都知道,美国时间本周二,澳洲时间周三上午,将会迎来美国大选以及直播投票结果。而截至今天,也就是周一下午,目前世界财经网站彭博社依然给出了几乎50%对50%的预测结果,也就是说,目前任何一方都没有完全胜算的把握。
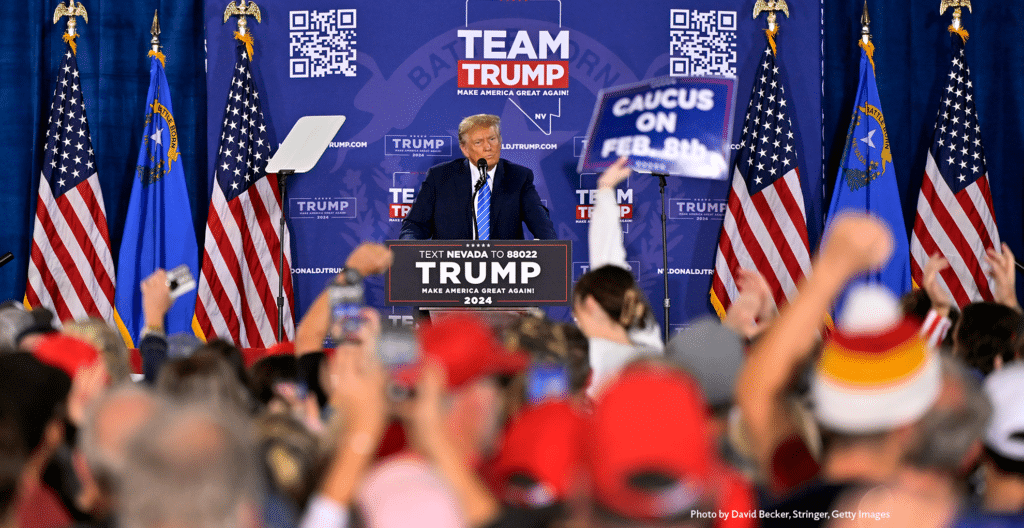
当然其实我们都知道,过去2次的大选,其实结果都和当初预测的相差很远:特朗普第一次获胜当时媒体普遍猜测希拉里将会当选。而4年前特朗普和拜登的对决里,媒体也预测特朗普会连任,因此经历了两次失败的预测后,现在美国媒体也被打怕了,干脆出一个50:50的预测。但是50:50的比例也意味着,美国民间选民已经被严重撕裂和相互对立。并且几乎已经达到了疯狂的阶段。不论是最流行的歌手Tyler还是好莱坞明星Tom Hanks或者特斯拉的马斯克,都选择了自己支持的阵营,这不算什么。关键是他们的发言,实在是太夸张了,在我看来完全就是极端化。应该说,在整个西方国家里,美国的总统选举过程,是最招摇,最极端,最让民间产生对立情绪的。
当然我们今天并不是要来评判美国的选举制度。我们今天马后炮一下,随便瞎说一下,为什么美国民间的选民会这么撕裂?1. 过度的政治正确最终导致了选民内心的崩溃:我们知道早在多年前,当中东叙利亚战争和阿富汗战争后,就有大量难民前往了欧洲和美国,澳洲也有。而这些国家也从一开始的欢迎和热情接待,到之后不断的硬着头皮处理大量社会治安事件。但是在公开场合,没有人敢于表达任何对于接收战争地区移民的不满。但是实际上,大量西方民间选民的真实思想,其实已经可以从他们的投票里看到:当初特朗普为什么可以出人意料的战胜希拉里,就是因为大量美国底层百姓不再信任所谓的精英政府。而是希望借助完全没有政治经验的特朗普,来打破之前那种虚伪,但是又看似非常得体的高大上美国政治。2. 过去几年疫情导致贫富差距进一步拉大:其实不仅仅在美国,包括澳洲,欧洲和世界几乎所有地区,在过去几年,由于物价飞涨,导致大部分普通民众的收入大量缩水,可用资金的减少直接导致了生活质量的下降。而另一方面,有资金投资的阶层则继续在股市里风生水起,美股澳股日本欧洲,都是不断在创下新高。这种巨大的差异还在不断拉大,最终导致了大量矛盾的爆发。以上说到的原因,任何人都无力短期内改变,就算是美国总统也无能为力。那我们普通百姓,还是生活在美国以外的百姓,在这次选举中需要做什么准备吗?我们分成不会改变的,和会改变的两种情况来看:
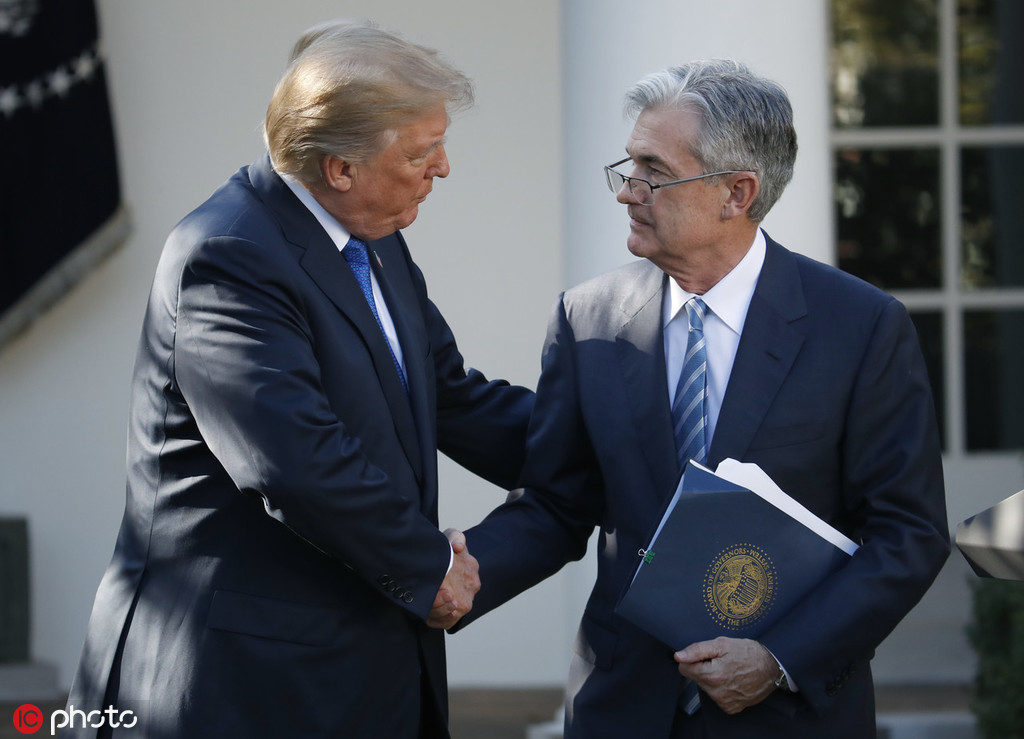
不论选举结果如何都不会改变的:1. 继续降息。美国不论谁当选,继续降息是板上钉钉的,但是相比于现任拜登,特朗普之前有过很多直接尝试影响美联储决定的言论和推特,但是总的来说,美联储有着很大的政策独立性,因此不论谁当选,都不太会改变目前的降息计划。2. 美国股市长期趋势上涨不变。和降息所对应的,就是对经济和股市的刺激。因此只要降息没有停止,对于股市的刺激作用就不会停。虽然不能说100%,但是大概率,股市将会在未来12个月内继续保持上涨。任何短期的回调,都是长期持仓的进场机会。3. 美国对中国的政策:这一点不论是那个当选都不会改变。而且未来可能在政策限制上会越来越多。4. 美国的美元地位:通常来说,美元地位都和美国在全球的军事参与和实力成正比,相反在和平时期,欧洲发展快速时期,美元的地位则会被削弱。而今我们知道哪哪都不太平,因此这时美元的地位将会非常稳定牢固。
会因为选举结果而改变的:1. 美国的对外贸易政策:目前两个候选人在主要贸易政策,例如关税问题上差别很大,而征收关税的多少,短期内将会直接导致美国国内通胀的变化,进而间接影响到降息的间隔时间。2. 美国在联邦层面对于债务的态度。我们知道美国是永远还不清美元债了,所以我们讨论的就是每年新增的债务数字是多,还是很多的差别。这个债务数字,和大政府开支或小政府开支有关,民主党讲究的是大政府,大开支,共和党则相反。最终美债也会影响到股市和美元阶段性的强弱。以上,只是我们基于目前掌握的信息给出的猜测和判断,最终谁也不知道这次谁会获胜。但是不论是谁,上面给大家总结的很多观点,尤其是有关降息和股市的部分,是一个大概率的结果。我们投资永远要记住一点:世上无绝对会成功的项目,但是只要有大百分比成功率的,我们就应该去尝试,去坚持。免责声明:GO Markets 分析师或外部发言人提供的信息基于其独立分析或个人经验。所表达的观点或交易风格仅代表其个人;并不代表 GO Markets 的观点或立场。联系方式:墨尔本 03 8658 0603悉尼 02 9188 0418中国地区(中文) 400 120 8537中国地区(英文) +248 4 671 903作者:Mike Huang | GO Markets 销售总监
热门话题
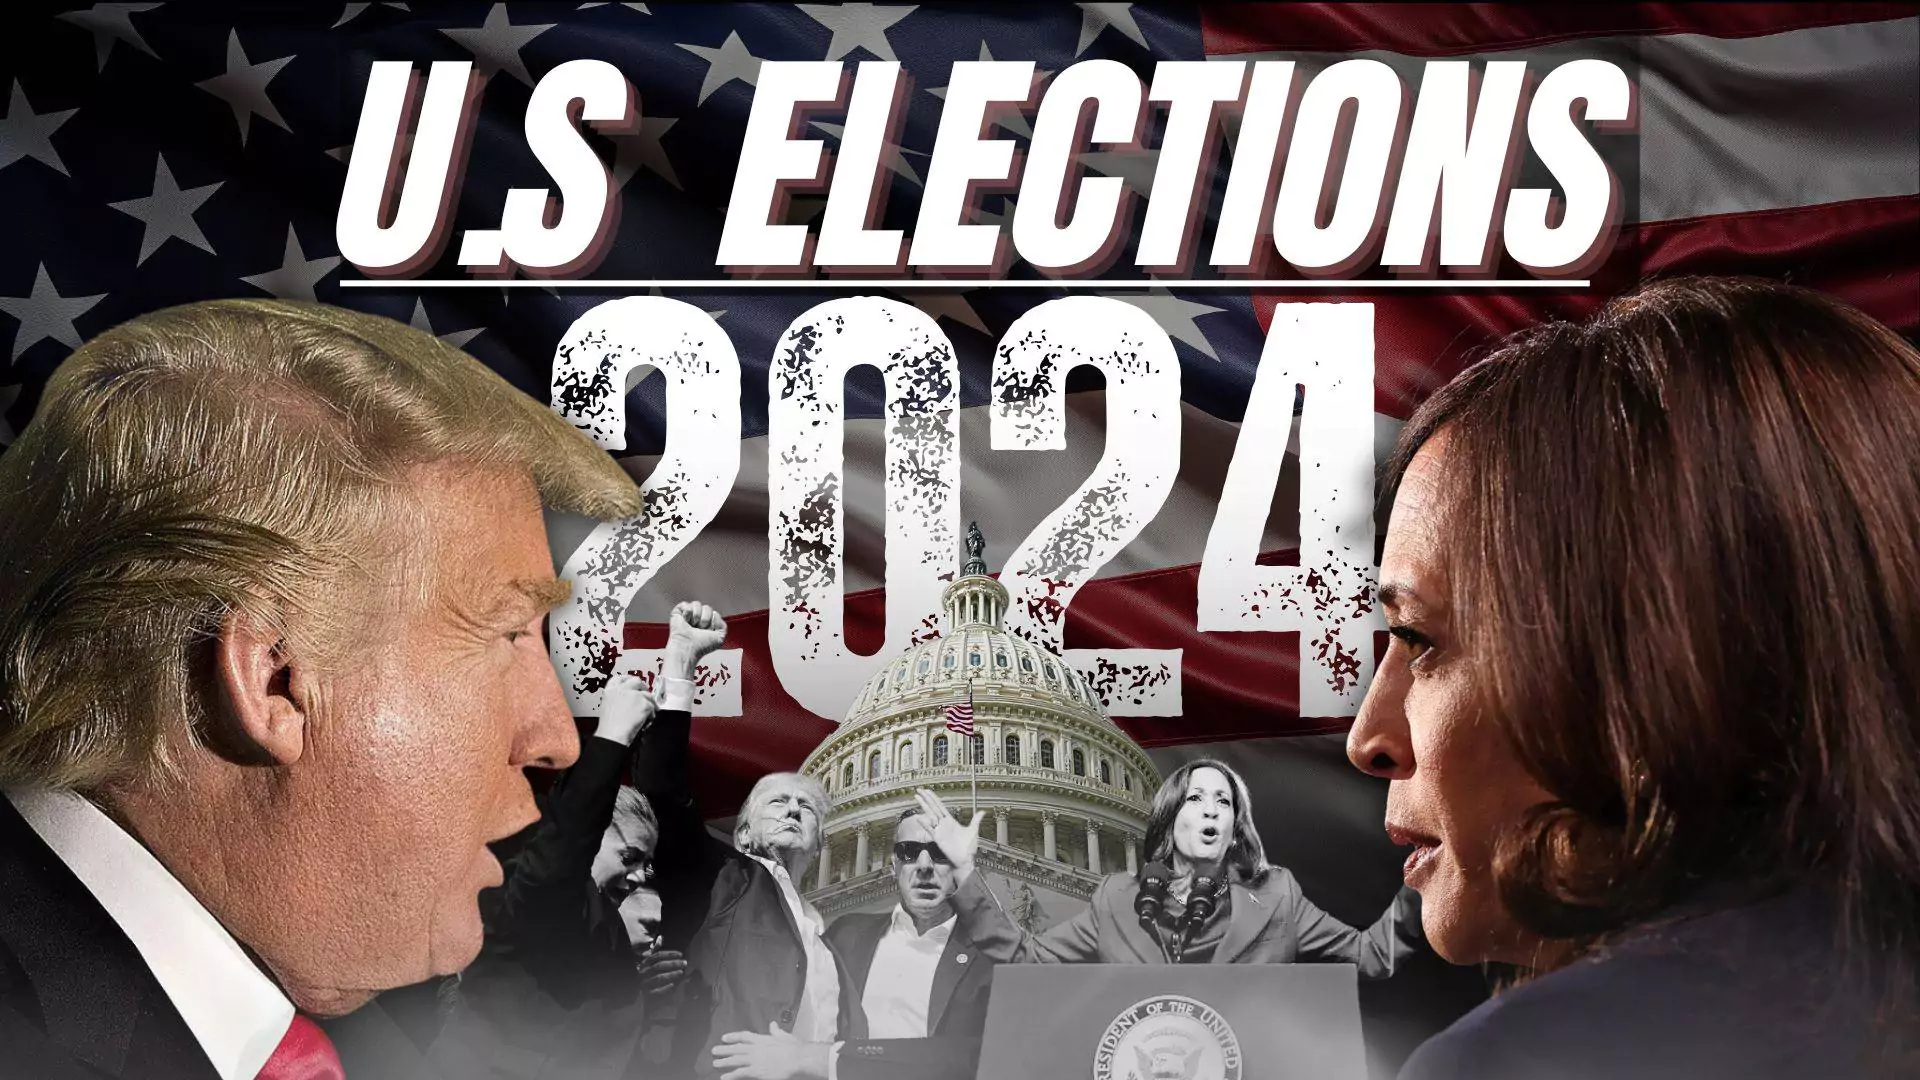
在经历完GDP,核心PCE和非农集中考验后的美股,正式结束10月行情,迎来11月契机。原本过去几年逢9月10月必大跌的魔咒在今年被破除,但9月的稳定并未持续到10月结束。今年财报季股指均回调的规律依然成立,过去半个月标普已经连收两周阴线,技术面与4月7月行情极为相似,财报季还未过去,新的一周继续回撤的可能性很大。在消息面,本周是降息开启后美联储预计连续第二次降息的一周,由于大选影响,利率决议将在澳洲时间周五清晨公布,届时鲍威尔新闻发布会依然是投资者关注的焦点。然而那时候美国大选结果已经出炉,新总统的决定是否会对美联储产生影响尚且不得而知。毕竟特朗普曾公开宣称总统应该有干预美联储的权利,若他当选或许是对鲍威尔施压的开始。
新的一周焦点无疑是美国大选和利率决议的碰撞。美国大选直接关系着股市热点板块的变化,毕竟政策风往哪边吹还得跟谁当总统有直接关系,在特朗普和哈里斯的竞选宣言中便可知一二。目前根据市场解读,哈里斯将秉承拜登一贯政策,其上台会进一步加速强化对新能源的开发和使用,对高科技特别是芯片公司的压力不会加大,对微软和META等支撑其竞选的巨头或更为友好,其经济路线或许更为迷茫,对国际形式的武力干预可能性会加大,对地缘政治的影响更为直接,中东战争或拉长时间线,对中国的态度尽管依然保持敌意,但经济层面的压力不会太大。如果是特朗普上台,首先受益的是其坚实好友马斯克,那么特斯拉也将直接受益。特朗普认为传统能源很难在未来5到10年内被替代,为了保持减缓对海外传统能源的依赖,其政策将更为注重本土传统能源行业的发展。另外特朗普一直不满美国芯片行业被台系企业控制,想要台湾缴纳保护费,其上台对英伟达台积电等台系公司的压力会加大。特朗普认为日本和中国的货币宽松低汇率政策导致美国本土产品失去了国际竞争力,其上台后第一件事就是要降低美元对日元的汇率以及美元对人民币的汇率,从疫情前美日仅100出头到现在的150以上,从整个加息周期后美元人民币汇率从6.3涨到一度冲破7.3,目前还在7.1以上,这都是特朗普无法接受的。还有更关键的一点是特朗普一直以其任内美国没有发动对外战争为自豪,也保证其上台后第一件事就是让中东和俄乌停战。因此特朗普的上台有利于国际局势的缓和,地缘政治直接武装冲突的可能会降低,有利于避险资金的流动。特朗普一贯擅长经济治国,其上任也能进一步助推美国经济活跃度,当然对中国政策方面或许会进一步加大贸易战力度,其曾经宣称的额外征收关税也会令中美经济合作更为艰难。
整体上看,美联储本周降息25个基点板上钉钉,并且基本已经被市场消化,鲍威尔先前透露的今年降息100个基点也越发变得清晰明朗,因此利率决议全看鲍威尔新闻发布会用词对市场的影响,而不是降息程度。由于离谱的非农数据和不及预期的三季度GDP,美联储明年进一步降息的力度将增加不少。而大选方面,目前特朗普获胜的概率更高一些,以今年特朗普所经历的离谱经验,他当选新一届美国总统的可能性也更高一些。免责声明:GO Markets 分析师或外部发言人提供的信息基于其独立分析或个人经验。所表达的观点或交易风格仅代表其个人;并不代表 GO Markets 的观点或立场。联系方式:墨尔本 03 8658 0603悉尼 02 9188 0418中国地区(中文) 400 120 8537中国地区(英文) +248 4 671 903作者:Xavier Zhang | GO Markets 高级分析师

热门话题
近期,美元在全球外汇市场中持续走强,美元指数创出新高,这一走势引发了广泛关注。通常情况下,美元和黄金价格呈反向波动关系,但近期两者却双双上涨,这与一贯的市场规律不符。究其原因,不仅是美国大选前的避险情绪增强,还受到最新经济数据的推动。我们将结合第三季度GDP、核心PCE和ADP就业数据等关键指标,分析美元和黄金走势的背后原因。
一、GDP与核心PCE指数:经济增速低于预期,通胀依然存在美国第三季度实际GDP年化季率初值录得2.8%,低于市场预期的3%。尽管GDP低于预期,但核心PCE物价指数年化季率初值为2.2%,高于预期的2.1%,表明通胀压力依旧存在。这种经济增速放缓但通胀压力未消的现象,让市场对美联储的加息前景更加关注。经济增速低于预期削弱了市场的信心,但通胀上升使得市场对美联储进一步紧缩政策的预期增加,支撑了美元的需求。避险需求加上通胀压力,形成了美元和黄金同涨的局面。二、10月ADP就业数据超预期:就业市场的韧性10月ADP就业人数录得23.3万人,创下2024年3月以来最大增幅,远超预期的11.4万人。这表明美国就业市场韧性十足,为美元提供了进一步的支撑。就业数据表现强劲为美联储继续保持紧缩政策提供了基础,也让市场对未来利率上升持乐观态度。然而,就业市场的强势与经济增速放缓之间存在矛盾,显示出美国经济在面临通胀和劳动力成本上升的双重压力下,可能会出现滞胀风险。美联储面临更为复杂的决策环境,而这种不确定性也提高了美元的避险需求。
三、美元与黄金的非传统联动现象:背后的原因美元和黄金通常呈反向关系,但近期却双双上涨,黄金价格甚至创下历史新高。出现这一现象的原因包括以下几点:全球避险情绪叠加:在大选前夕,市场对未来美国政策的不确定性加剧。投资者倾向于同时持有美元和黄金以对冲风险。这种避险情绪在大选前尤为强烈,使得两者同涨的现象较为明显。通胀压力支撑黄金需求:前文我们提到过,尽管美元走强,但核心PCE上升反映出通胀依然存在。黄金作为对抗通胀的工具,其避险和抗通胀属性吸引了大量资金涌入。市场对全球经济不确定性和通胀预期的双重担忧,使黄金继续受到追捧。美元的全球性需求增加:尽管美元走强,许多新兴市场国家和企业对美元的需求仍在增加,尤其是在本币贬值的情况下。美元的强势带动了黄金的资金流入,形成了美元和黄金的同步上涨。四、美元和黄金的未来走势展望未来,美元和黄金的联动关系是否会持续取决于多个因素。首先,美国大选的不确定性依然是推动美元和黄金双双走高的重要因素。但是,未来美元和黄金的走势一定是有面临分化的可能性。若经济增速放缓和通胀压力持续共存,可能会形成“滞胀”局面,促使投资者更多地转向黄金。若就业数据和GDP增速继续稳健,则会加大美联储收紧货币政策的预期,利好美元,但对黄金的需求可能会有所下降。

那么既然大选的结果也会影响到美元和黄金的未来走势,如果我们简单的分类讨论一下的话特朗普上任:美元强势与黄金走弱的可能性。如果特朗普当选,他可能会推行更激进的经济刺激政策,比如减税和放松企业监管,以刺激国内经济增长。这可能会提升市场对美国经济的信心,进一步支撑美元。与此同时,财政赤字的上升和政府对“美国优先”的经济立场,可能减少市场对避险资产的需求,从而压低黄金价格。哈里斯上任:美元疲软与黄金上涨的趋势。哈里斯当选后,可能会倾向于增加社会福利、推行绿色经济政策,这些政策可能带来较高的财政支出,进而加重赤字负担。这可能导致美元走弱,尤其在美国债务风险增加的情况下。此外,她的政策可能增加对黄金的需求,投资者会视黄金为对冲通胀和经济不确定性的工具,因此黄金价格可能会上涨。结语近期美元与黄金的同步上涨反映出市场对美国经济前景的不确定性和全球避险需求的增加。在美国大选和通胀风险的双重影响下,美元和黄金的“非传统联动”可能会持续一段时间。然而,随着未来更多经济数据的公布和政策走向的明朗,美元和黄金的联动趋势可能逐渐分化,投资者需密切关注以应对潜在风险。免责声明:GO Markets 分析师或外部发言人提供的信息基于其独立分析或个人经验。所表达的观点或交易风格仅代表其个人;并不代表 GO Markets 的观点或立场。联系方式:墨尔本 03 8658 0603悉尼 02 9188 0418中国地区(中文) 400 120 8537中国地区(英文) +248 4 671 903作者:Yoyo Ma | GO Markets 墨尔本中文部

The consensus for the monthly Consumer Price Index (CPI) is for a rise to 3.8% annually in May, the range being 3.6% to 4.0%. This would be the fourth consecutive rise in yearly inflation and would show that not only is inflation ‘sticky’ it could be considered ‘entrenched’ Monthly CPI indicator YoY% This headline will cause large initial reactions from both the FX and bond markets. Considering the hawkishness in which the governor has spoken about getting inflation back to target inside its 18-month timeframe the market will see this as another confirmation that the August meeting is more than just live but a very probable moving event.
You only have to look here at the 30-day interbank market to see long calls are being made although not at a large scale (yet). Since breaking out in late May on signs inflation has become sticky and rate rises rather than cuts are the more likely RBA response in the near term. The pair has become range bound between $0.658 and $0.672.
AUD/USD Which brings us as to why May might be the last CPI rise before it begins a long slow decline into the target range. Notable Influences on May Inflation Fuel: Prices declined significantly in May, more than offsetting April’s increase. However, they rose again during June to over 200c/l.
Food: Inflation eased modestly over the year, with restaurant meals and takeaway food prices moderating on weak demand. Rents: Returned to the average 0.7% monthly after the temporary rent assistance indexation. Clothing & Footwear: April’s unexpected price increase is expected to reverse in May amid ongoing weak retail conditions and the onset of end-of-financial-year sales.
Electricity: Victoria’s rebates expire, with significant price drops anticipated from July due to new federal and state rebates. Firstly, we need to point out that May 2023 has several factors come into play that will create an artificial upside. For example, the expiration of electricity rebates in Melbourne there are several other similar government interventions that also impact in the same way.
Then there is the persistent high inflation in sectors like insurance, which will obscure the declining progress being made in market services inflation. Now we need to highlight that the consensus view is the downward trend will resume in June, consensus forecasting (remembering that there is a lot of data that can shift this ahead of the July 31 release) for Q2 2024 headline CPI sits a 3.6% annually the RBA’s Statement of Monetary Policy (SoMP) is at 3.8%. Prices were unusually weak in May last year, due to significant drops in domestic travel (-15.5% monthly) and fuel (-6.7% monthly), which together account for approximately 7% of the CPI basket.
Large declines of this nature are not expected to repeat this year. Additionally, rebates and changes to electricity prices as energy rebates in Victoria expire, contrasting with the quarterly payments in other states this explains why consensus has CPI falling post May. On electricity pricing expectations are for prices to fall by around 20% in July as new rebates are introduced.
Consensus also anticipates a significant drop in clothing and footwear prices, reversing the April increase. The growth in average monthly spending on clothing and footwear shown in the latest credit card data was the lowest for May since the pandemic. Then you have the seasonal decline in holiday travel and accommodation prices post-school holidays.
Put this all together and it should make plain that Wednesday’s CPI monthly read could be a trap for traders. Why? Yes continued rise in the monthly CPI indicator will be unwelcome news for the Reserve Bank of Australia (RBA).
However, the RBA has emphasised that the quarterly CPI release remains the benchmark inflation figure in Australia. With that being the case – watch for snap back in any bullish moves in the currency. Because although its challenging to predict the trimmed mean CPI based on monthly CPI indicators.
Expectations are that core CPI (which can vary significantly from the quarterly trimmed) comes between 0.8% and 0.9% quarterly. This will be refined post the May CPI but all the same it is likely to be lower quarter on quarter. If we use the RBA’s latest forecasts the headline rate 1.0% on a quarterly basis (3.8% annually).
Trimmed mean CPI is sitting at 0.8% on a quarterly basis (3.8% annually). These are the keys to trading CPI going forward as the underlying detail will be key. First break out market services.
Watch meals out and takeaway, hairdressing services, insurance, sporting and cultural services, and sports participation. Then we need to see modest consumer spending growth for discretionary items and an easing in wages growth this would result in further disinflation for market services, which is paramount to getting inflation back into the target band. CPI Breakdown for May Category April Weight Annual % Change Monthly % Change Expected Annual % Change Food and non-alcoholic beverages 17% 3.8 0.4 3.1 Alcohol and tobacco 7% 6.5 0.0 6.4 Clothing and footwear 3% 2.4 -2.2 2.1 Housing 22% 4.9 0.5 5.3 Furnishings, household equipment & services 8% -0.8 0.3 -0.8 Health 6% 6.1 0.0 6.1 Transport 11% 4.2 -0.7 5.6 Communications 2% 2.0 0.5 1.7 Recreation & culture 13% -1.3 -3.3 -0.1 Education 4% 5.2 0.0 5.2 Insurance & financial services 5% 8.2 0.6 7.6 CPI Indicator - 3.6 -0.3 3.7

FX and indices traders are now on notice – the race to restart economies is upon us. We have to-date seen Riksbank and SNB move policy but with the Bank of Canada (BoC) now entering the rate cut movement – the race is now well and truly on and the interest rate differentials that come into play with currencies will ramp up. Potential for Further Cuts In a move that surprised some analysts but aligned with market expectations, the Bank of Canada (BoC) has reduced its policy rate from 5.0% to 4.75%.
It’s the first time the BoC has cut rates since March 2020. It is a clear shift in thinking and reflects a much more dovish stance than anticipated. It also sends a clear willingness to further lower rates if inflation continues to ease and confidence in reaching the 2% inflation target grows.
The impact on the CAD and Canadian bonds post the decision is stark. USD/CAD (source Refinitiv) However the post-reaction even more interesting. The spike and then sell off is a clear recognition from FX traders and fund managers that if the BoC is moving rates the Fed is not far off it either. (More on this below) A Dovish Turn So what has led to the dovish turn from the BoC and what can been extrapolated to over similar geographics from the BoC Decision?
Based on current domestic inflation data, headline Consumer Price Index (CPI) is expected to moderate, helped by factors such as easing mortgage costs. The primary reason for the rate cut was the slowing of core inflation and the reduction in broad-based inflation increases. We should point out that Europe, the UK and Canada are seeing this – Australia and the US not so much.
There is uncertainty about whether core inflation will continue to improve as favourably in the coming months – and the more hawkish BoC watcher were keen to point this out The Canadian Federation of Independent Business (CFIB) suggest that core inflation might stabilize around 2.5-3% which is above the levels most would predict for further cuts. However, history shows the BoC like most central banks never really goes ‘one and done’ it is normally coupled with two or three moves. Which again suggests CAD crosses against those economies that are not likely to see rate cuts in the coming months will benefit as the CAD falls.
South of the Board - US Economic Activity A weakening US labour market and economic activity are expected to spill over to Canada, potentially impacting Canadian economic growth. This development is currently not in the BoC’s base case, which expects stronger growth in Canada this year. BoC Governor Tiff Macklem's comment that “there is room for growth even as inflation continues to recede” suggests that officials expect a scenario of stronger growth with easing inflation in the coming months.
Any deviation from this expectation towards weaker growth would likely prompt more dovish policy actions. Recent data suggests Macklem and Co. might have to rethink this view Data Dependence and Future Rate Decisions Like all central bankers looking for their ‘get out of jail free card’ - BoC officials have consistently emphasised data dependence in their making decisions. Which is interesting as recent Canadian activity data, was showing strong job growth, yet this was somewhat downplayed in the decision – this could also feed into the reaction of the CAD in the hours post the decisions as the initial dovishness was evaluated with a hard lens.
Employment is described as growing at a slower pace than the working-age population, a trend that has persisted even pre-pandemic. If activity data continues to evolve as it has recently and core inflation picks up in May and June CPI data, the BoC may forego a rate cut in July. However, the base case scenario anticipates some slowing in activity and particularly weakening US data, which could result in updated growth forecasts in the July Monetary Policy Report (MPR) being less favourable than in April.
This alone could lead the BoC to cut rates again in July. Where does that leaves us? The BoC cut to 4.75% marks a shift towards more accommodative monetary policy amidst a complex economic landscape.
With inflation showing signs of moderation and potential headwinds from the US economy, the BoC remains vigilant and data dependent. Future rate decisions will hinge on the evolving economic conditions and inflation trends, with further cuts likely if the current trajectory of easing inflation and economic activity persists. CAD now very much sits in the dovish and weaker end of the G10 currencies.
That bias is unlikely to change again the likes of the AUD which is clearly sitting at the higher end of the G10 spectrum. So that’s Canada – what about Europe? All things being equal - the European Central Bank (ECB) is poised to start cutting interest rates for the first time in nearly five years tonight.
In a move well forecasted to the market it is expected to stimulate the eurozone economy that is now flirting with, or in some case already in recession. To put this decision into some context - the ECB had previously raised its benchmark deposit rate to a historic high of 4% to combat significant inflation caused by supply side issue out of COVID and the war in Ukraine. Consensus suggest that the scope of economic stimulus will depend almost purely on the extent of the total rate reductions rather than other programs the ECB has engaged in in the past.
For example something that might hamper the economic recovery through rate cuts in Europe is rapid wage growth leading to high inflation limiting the number of cuts expected. This is certainly impacting the thinking of traders, the EUR has a known cut cycle in front of it – yet its holding relatively well suggesting traders are not as dovish on rates as economist and the ECB is. Thus it’s not the announcement that traders and investors will focus on.
It’s the guidance from ECB president Christine Lagarde regarding future monetary policy. The stated aims currently in lowering rates is to invigorate housing markets, business investment, and consumer spending, which have been restrained by high borrowing costs. Which have significantly impacted economic activity, but with inflation pressures now easing slightly, the bank sees an opportunity to support growth.
There is also a growing amount of evidence that is suggesting the economic behaviour of Europeans is already changing from the expected cuts. The public awareness of the cuts is boosting sentiment among households and businesses and may also mean rates don’t have to move as much to stimulate. The eurozone economy showed signs of recovery in early 2023, with a GDP increase of 0.3% in the first quarter, ending a period of stagnation.
This growth was largely due to subsiding energy and food price shocks coupled with a global trade recovery. But it was also aided by the anticipated rate cuts lowering mortgage and corporate loan costs. In Germany, house prices, which have dropped by 10% following the ECB’s rate increases, have started to stabilize as mortgage rates have fallen from nearly 4% to below 3.2%.
This has led to a noticeable increase in mortgage financing demand, spurring a housing market upturn. Similarly, in the Netherlands, rising wages, housing shortages, and lower mortgage costs are expected to push house prices to new highs. And as mentioned - the eurozone's robust labour market is contributing to persistent inflation, with wage growth hitting a record pace and unemployment reaching a low of 6.4% in April.
This strength may prompt the ECB to slightly adjust its inflation and GDP growth forecasts upward – which again supports the markets view that the EUR may perform better than against a CAD for example. Thus the ECB is likely to proceed cautiously with rate cuts. Influential ECB officials suggest a gradual pace, with only a few cuts anticipated this year to maintain flexibility and ensure inflation continues to decline towards the 2% target.
The ECB's approach contrasts with previous rate cuts cycles in the zone, which were typically reactions to economic crises. This time, the cuts are being made in a context of improving economic conditions, suggesting a measured approach to avoid overheating the economy. Overall, while the initial rate cut is seen as a certainty, the future path of ECB policy will depend on ongoing economic developments and inflation trends, with the bank aiming to balance stimulating growth and controlling inflation.
A tough fundamental backdrop for EUR traders.

Never has the oil been trickier than it is right now. The influences on the price are complex, varied and time dependent. It’s even trickier when you look at it from the trade of commodities versus equities.
Here are the key things that are catching our attention with oil trading in spot, forwards and equities. Spot vs. Anticipatory Market While WTI and Brent prices are influenced by current ('spot') market conditions, they are not solely determined by them.
There is a level of anticipation of supply, and these are priced through mechanisms like storage and forward curves. This allows the market to shift supply into the future or pull it forward as required. Right now however, demand and supply are so out of traditional cycles, pull forwarded supply is being re-stocked and future supply cut to offset the current scenario.
This might explain why forward curves are inverting – these curves are crucial in regulating the anticipatory nature of oil prices. Forward curves represent the market's expectation of future prices and influence current trading behaviours. Clearly even with supply cuts.
The market expects price to fall further if the forward curves are to be believed. Investment Time Horizons Do not forget the fundamental market pricing in equities. Share prices reflect prospective multi-year earnings growth.
The future earnings of a company can drive up its stock price today because equities discount future earnings to the present. This can explain why oil espoused equities are outperforming spot prices. The spot market does not look as far ahead.
Recent Market Reaction: The sharp negative reaction to OPEC's recent production decision seems irrational in light of the projected tightening of the oil market. The analysis indicates that crude oil inventory draws could reach up to 2 million barrels per day (mb/d) during the third quarter (3Q), suggesting a tighter market. Despite this, the current market sentiment reflects a different view, possibly driven by shorter-term concerns or overreactions to OPEC's decisions.
Seasonal Considerations: Between May and August, global demand for refined products typically rises by approximately 3.2 million barrels per day (mb/d). A similar increase is expected for 2024, driven by seasonal factors. Fundamentals assume oil prices reflect the expected supply/demand balance about 2-3 months into the future.
With that in mind, and looking at demand history Brent might have found a floor in the high-$70s per barrel range and are likely to recover in the coming months. The front-month Brent future for August delivery, are above July and shows that traders are already factoring in the peak northern summer demand. But, and it’s a big But, unlike last year's northern summer tightness which significantly boosted Brent prices higher-than-expected, inventories have tempered expectations.
Thus, calls for Brent to reach $90 per barrel now appear overly ambitious. With inventories higher than previously anticipated, the short-term forecast has been adjusted downward by $1.5 to $4 per barrel for the coming quarter to $$80-$86 a barrel. Post the northern summer period futures are falling fast as those seasonal demands, turning tailwinds into headwinds.
Previous forecasts already showed a declining price trend post the summer quarter. Considering the anticipated surplus in 2025, Brent prices may struggle to maintain the $80 per barrel mark next year. And this will start to impact not just spot and futures but also equities.
The OPEC dynamic OPEC has extended its production cuts, including additional voluntary cuts, through the end of 3Q. Assuming compliance (watching Iran, Iraq and Venezuela here) OPEC production is expected to remain stable during this period. OPEC is expected to remain proactive in managing production levels.
There is a realistic chance that OPEC will limit the unwinding of production cuts well into 2025, preventing a significant price drop and regulate price extraction. Saudi Arabia is known to want a floor in the price at $85 a barrel. Then there is non-OPEC – a temporary slowdown in non-OPEC supply growth is anticipated due to the timing of new projects.
This is interesting as historically non-OPEC loves to step in and soak up cuts from OPEC but appear to be caught slightly on the hop this time around. Limited production growth is expected through September but will increase into the back half of the year and into 2025 as OPEC holds the line. This push pull between the two groups is likely to see a supply surplus and modelling suggests this will make maintaining Brent prices above $80 per barrel challenging.
A full $5 below the comfort level of OPEC. It suggests that OPEC could step in again and cut supply to drive the price higher. However this is when we would expect smaller nations in the OPEC group to splinter as the impact on them is greater than larger players.
Implications for Market Participants Short-term Traders: Should focus on the anticipated supply-demand balance in the next 2-3 months. The expected tightening in 3Q suggests potential price support or increases in the short term. Be ready for price shifts in September and rapid changes in curve the closer we get to August expiry.
Long-term Investors: Need to consider the broader outlook, including potential seasonal shifts, OPEC's future production decisions, and long-term production growth from non-OPEC countries. Look also to forward earnings estimates, possible consolidations and firms that start to pivot from pure oil exposure. This is gaining momentum at the likes of BP, Shell, Woodside and the like.
The long-term dynamic of oil is really that of structural decline as the world moves to renewables and EVs. This is years away no doubt, but the changes and future earnings impacts are starting now – so be alert. Overall, while immediate market reactions can sometimes seem disconnected from longer-term fundamentals, a nuanced understanding of both short-term and long-term factors is crucial for effective oil market analysis and trade decision-making.
The recent analysis reflects adjustments based on current market conditions and forward projections and we hope this provides a baseline for those of you looking at oil and the tricky trading conditions that are present.