We are less than three weeks away from the ASX earning season and we are less than two weeks away from the earnings season in the US. So, we need to start prepping for trades and opportunities now. First and foremost, do not forget that confession season is well and truly upon us here in Australia.
Downgrades clearly have been coming from the discretionary sector; we've even seen companies hit the wall with the likes of Booktopia going into administration. There are some clear thematics that are growing in the Australian market. Energy, while the worst performing sector for the financial year 2024, may actually show you that earnings were slightly above expectation on higher than expected oil prices.
Materials led in the main by BHP, Rio and FMG Have once again benefited from higher than expected iron ore prices. It also benefited from a lower than expected AUD/USD where average FX prices were expected to be between $0.68 and $0.73 but instead have averaged between $0.63 and $0.67. What we're looking for is operational costs, overall margins and forward looking guidance, something that these firms have lacked in the last three financial updates.
Watch very closely for the excitement that will come from things like copper at the expense of the issues that are facing nickel lithium and other transition metals that have had really tough periods in FY24. Moving to the banks this is a sector people argue is fully valued. It's not hard to argue when through the financial year CBA made record all time highs several times and is still within a whisker of its record all time high.
Higher interest rates will indeed improve net interest margins. However, the unknown question and what we need to see at its August full year earnings is the impact higher rates are having on bad and doubtful debts, the possible increase in provisioning and more importantly the impact its having on new loans and refinancing. There is an argument to be made that banking is possibly fully priced and no matter what result is delivered won't necessarily create a leg further higher.
Finally, you can't go past consumer staples and discretionary. Retail sales numbers over the last 18 months have actually shown discretionary spending At or above 2022 levels although month on month figures have been erratic. The question that will come for discretionary spending is margins and how much sales revenue translates to the bottom line in earnings and profit.
Staples on the other hand have seen consistent movement on the revenue line but the question will be the margin and after the very targeted senate inquiry into supermarkets any sign profits are above trend may actually be met with concern as geopolitics raises its head. 33 times in 2024 the US 500 and the Tech 100 have made record highs – can it continue? Look into the US and the ending season that it is about to undertake. We have to look at several core thematics that are likely to be raised.
Artificial Intelligence (AI) The question you’ve got to ask is: is the time frame long or short? We raised this Mag 7 stocks etc Microsoft, Amazon, Alphabet, apple have clear potential. They are evolving their business models and see the integration of AI as the future of their individual businesses.
That will likely come up in their numbers but it will come with operational and initial upfront costs as the integration of AI begins. This is all long term may not fully capture short term opportunities which is still presenting very much in the semiconductor providers. NVIDIA and Advanced Micro Devices are taking full advantage and monetizing the compute cycle.
This clearly won't be forever because it will go from semiconductors to infrastructure to software and therefore the flows will move back towards the bigger end of town but overall the AI thematic still flows towards the semiconductors for now and that's likely to be shown in the earnings season that's coming. Data Centres That brings us to data centres because the potential for ensuring AI requires a heck of a lot of storage and a heck of a lot of processing. There are estimates the data centres will need to grow by 420% in Europe and 250% in the US by 2035 based on the rate of growth in AI right now.
Therefore, we need to watch providers like Dell Technologies and Intel which are big providers of data centres currently. We think the market hasn’t fully appreciated DC needs in the AI revolution. Cybersecurity The final key theme in the AI data centre technology space that we also think needs to be watched is cyber security.
It's been something along the lines of a 70% increase in ransomware attacks over the past 24 months. The regulatory requirements and the budgets required to deal with these increased threats is only just beginning. That brings players like Fortinet to the fore IT programmes and it's pensively to develop programs for enterprise makes it an interesting one going forward.
GLP-1 ‘Weight Loss’ Medicines Another theme of being a really strong driver of the S&P 500 is the rise of GLP-1 medicines. The weight loss craze that has come off the back of this Amazon has been incredible. Initially obviously developed for diabetes but having an additional effect of weight loss has created a product out of nowhere.
Eli Lilly and Co is a key player in this space with its GLP one class medicines already approved by the FDA. It's been launched in the US and its oral intake has posted adoption. It is not the only one in this space but shows very clearly the impact weight loss medicines are having on earnings.
The caveat we have though is side effects and long term impacts are still being found and could be said as a capping issue on price. Whatever way you look at it the US dating season however will be incredibly exciting and it is the reason The US markets continue to see huge capital inflows as they are much more exciting in this current environment than traditional value markets such as Australia.
By
Evan Lucas
The information provided is of general nature only and does not take into account your personal objectives, financial situations or needs. Before acting on any information provided, you should consider whether the information is suitable for you and your personal circumstances and if necessary, seek appropriate professional advice. All opinions, conclusions, forecasts or recommendations are reasonably held at the time of compilation but are subject to change without notice. Past performance is not an indication of future performance. Go Markets Pty Ltd, ABN 85 081 864 039, AFSL 254963 is a CFD issuer, and trading carries significant risks and is not suitable for everyone. You do not own or have any interest in the rights to the underlying assets. You should consider the appropriateness by reviewing our TMD, FSG, PDS and other CFD legal documents to ensure you understand the risks before you invest in CFDs.
Se você já passou algum tempo examinando um terminal de negociação, já o viu. Uma manchete de notícias é exibida, uma linha do gráfico se rompe e, de repente, todos correm para a mesma saída ou para a mesma entrada. Parece um caos. Na prática, geralmente é uma cadeia de respostas mecânicas.
Isso é importante por alguns motivos. Muitos leitores presumem que a história é uma profissão. Não é. A história, seja uma decisão sobre a taxa de juros, um choque na oferta ou uma perda de lucros, é o combustível e o manual é o motor.
Abaixo estão sete estratégias principais frequentemente usadas na negociação de contratos por diferença (CFDs). Com CFDs, você não está comprando o ativo subjacente. Você está especulando sobre a mudança no valor. Isso significa que um trader pode assumir uma posição longa se o preço subir ou uma posição curta se cair.
Sete estratégias para entender primeiro
1. Seguindo a tendência (o jogo do establishment)
O acompanhamento de tendências trabalha com base na ideia de que um mercado já em movimento pode permanecer em movimento até encontrar um obstáculo estrutural claro. Alguns participantes do mercado a veem como uma abordagem baseada em gráficos porque se concentra na direção predominante, em vez de tentar definir um ponto de inflexão exato.
A justificativa: O objetivo é identificar uma tendência direcional clara, como máximos e mínimos mais altos, e seguir esse impulso em vez de se posicionar contra ele.
O que os traders procuram: As médias móveis exponenciais (EMAs), como a EMA de 50 ou 200 dias, são comumente usadas para interpretar a força da tendência, embora os indicadores possam produzir sinais falsos e não sejam confiáveis por si só.
Fonte: GO Markets | Apenas exemplo educacional.
Como funciona: A EMA de 50 períodos pode atuar como um nível de suporte dinâmico que aumenta à medida que o preço sobe. Em uma tendência de alta, alguns traders observam que o mercado alcance uma nova alta (HH) e, em seguida, recuam em direção à EMA antes de subir novamente. Cada baixa mais alta (HL) pode sugerir que os compradores ainda estão no controle.
Quando o preço atinge ou se aproxima da EMA de 50 períodos durante essa retração, alguns traders tratam essa área como uma potencial zona de decisão, em vez de presumir que a tendência será retomada automaticamente.
O que assistir: A sequência de HhS e HLs faz parte da evidência estrutural de uma tendência. Se essa sequência quebrar, por exemplo, se o preço cair abaixo do HL anterior, a tendência pode estar enfraquecendo e a configuração pode não se manter mais.
2. Range trading (o jogo de pingue-pongue)
Os mercados podem passar longos períodos se movendo lateralmente. Isso cria um intervalo em que compradores e vendedores estão em equilíbrio temporário. A negociação de faixas é construída em torno desse comportamento, com foco em movimentos próximos à parte inferior e superior de uma faixa estabelecida.
A justificativa: O preço se move entre um piso, conhecido como suporte, e um teto, conhecido como resistência. Movimentos próximos a esses limites podem ajudar a definir a largura do intervalo.
O que os traders procuram: Alguns traders usam osciladores como o Índice de Força Relativa (RSI) para ajudar a avaliar se o ativo parece sobrecomprado ou sobrevendido perto de cada limite.
Fonte: GO Markets | Apenas exemplo educacional.
Como funciona: O nível de suporte é uma zona de preço em que os juros de compra têm sido historicamente fortes o suficiente para impedir que o mercado caia ainda mais. O nível de resistência é onde a pressão de venda historicamente impediu ganhos adicionais.
Quando o preço se aproxima do suporte, alguns traders procuram sinais de uma possível recuperação. Quando se aproxima da resistência, eles procuram sinais de que o ímpeto pode estar diminuindo. Leituras de RSI abaixo de 35 podem sugerir que o mercado está sobrevendido perto do suporte, enquanto leituras acima de 65 podem sugerir que ele está sobrecomprado perto da resistência.
O que assistir: O principal risco na negociação de faixas é uma ruptura, quando o preço sobe decisivamente para qualquer um dos níveis com forte impulso. Isso pode sinalizar o início de uma nova tendência e usar um stop-loss fora da faixa em cada negociação pode ajudar a gerenciar esse risco.
3. Breakouts (o jogo da mola em espiral)
Eventualmente, cada faixa fica sob pressão. Uma ruptura acontece quando o equilíbrio muda e o preço passa por suporte ou resistência. Os mercados alternam entre períodos de baixa volatilidade, em que o preço se move lateralmente em uma faixa estreita, e explosões de alta volatilidade, onde o preço pode fazer um movimento direcional maior.
A justificativa: Às vezes, uma consolidação silenciosa pode ser seguida por uma expansão mais ampla na volatilidade. Quanto mais apertada for a compressão, mais energia poderá ser armazenada para o próximo movimento.
O que os traders procuram: As bandas de Bollinger são frequentemente usadas para interpretar mudanças na volatilidade. Quando as faixas se apertam, um aperto está se formando. Alguns participantes do mercado veem uma mudança fora das faixas como um sinal de que as condições podem estar mudando.
Fonte: GO Markets | Apenas exemplo educacional.
Como funciona: As bandas de Bollinger consistem em uma linha média, a média móvel de 20 períodos e duas bandas externas que se expandem ou se contraem com base na recente volatilidade dos preços. Quando as faixas se estreitam e se aproximam, o aperto, o mercado fica excepcionalmente calmo.
Isso geralmente é descrito como uma mola em espiral. A energia pode estar se acumulando e um movimento mais nítido pode ocorrer. Alguns traders tratam o primeiro movimento através de uma faixa externa como uma pista inicial sobre a direção, em vez de um sinal definitivo por si só.
O que assistir: Nem todo aperto leva a uma forte fuga. Uma falsa quebra ocorre quando o preço se move brevemente para fora de uma banda e, em seguida, reverte rapidamente para dentro. Esperar que a vela se feche fora da faixa, em vez de entrar no meio da vela, pode reduzir o risco de ser pego em um movimento falso.
4. Negociação de notícias (o jogo de desvio)
Isso é negociação orientada por eventos. O foco está na lacuna entre o que o mercado esperava e o que os dados ou manchetes realmente forneceram. A divulgação de dados econômicos, como números de inflação (IPC), relatórios de emprego e decisões do banco central, pode causar movimentos bruscos e rápidos nos mercados financeiros.
A justificativa: Divulgações de alto impacto, como dados de inflação ou decisões do banco central, podem forçar uma rápida reavaliação dos ativos. Quanto maior a surpresa em relação às expectativas, maior pode ser a mudança.
O que os traders procuram: Os comerciantes costumam usar um calendário econômico para monitorar o tempo. Alguns se concentram em como o mercado se comporta após a reação inicial, em vez de tratar o primeiro movimento como definitivo.
Fonte: GO Markets | Apenas exemplo educacional.
Como funciona: Antes das notícias, o preço pode se mover em uma faixa calma e estreita enquanto os traders esperam. Quando os dados são divulgados, se a leitura real diferir significativamente da expectativa de consenso, a reprecificação pode acontecer rapidamente.
O ouro, por exemplo, pode aumentar drasticamente em uma leitura do IPC que esteja acima das expectativas. No entanto, a vela também pode imprimir um pavio superior muito longo, o que significa que o preço atingiu o pico máximo, mas foi fortemente rejeitado. Os vendedores podem intervir rapidamente e o preço pode diminuir. Esse padrão de pico e retrocesso é uma das configurações mais reconhecíveis na negociação de notícias.
O que assistir: A direção e o tamanho do pico inicial nem sempre contam a história completa. O comprimento do pavio pode oferecer uma pista importante. Um pavio longo pode sugerir que o movimento inicial foi rejeitado, enquanto mechas mais curtas após a liberação de dados podem indicar um movimento direcional mais sustentado.
5. Reversão média (o toque do elástico)
Às vezes, os preços podem subir muito, muito rápido. A reversão média se baseia na ideia de que um movimento exagerado pode voltar à sua média histórica, como um elástico apertado com muita força e depois recuando.
A justificativa: Essa é uma abordagem contrária. Ele busca períodos de otimismo ou pessimismo que podem não ser sustentáveis e posições para um retorno ao equilíbrio.
O que os traders procuram: Um exemplo comum é o preço se afastando bem de uma média móvel de 20 dias (MA), enquanto o RSI também atinge uma leitura extrema. Nessa configuração, os traders observam um retorno à média, em vez de uma continuação para longe dela.
Fonte: GO Markets | Apenas exemplo educacional.
Como funciona: O MA de 20 períodos representa o preço médio recente do mercado. Quando o preço se move para uma zona extrema, como mais de 3 desvios padrão acima ou abaixo dessa média, ele se afastou muito de sua tendência recente.
Um RSI acima de 70 pode sugerir que o mercado está esticado para cima, enquanto abaixo de 30 pode sugerir o mesmo para o lado negativo. Alguns negociadores de reversão significam que usam esses sinais combinados como um sinal de que uma retração em direção à MA de 20 períodos pode ser possível, em vez de presumir que o movimento continuará a se estender.
O que assistir: As estratégias de reversão média podem acarretar riscos significativos em mercados com fortes tendências. Um mercado pode permanecer estendido por mais tempo do que o esperado, e uma posição inserida contra a tendência de curto prazo pode gerar grandes rebaixamentos. O dimensionamento da posição e os stop-loss claros são essenciais.
6. Níveis psicológicos (o grande jogo de figuras)
Os mercados são movidos por pessoas, e as pessoas tendem a se concentrar em números redondos. USD 100, USD 2.000 ou paridade de 1.000 em um par de moedas podem atuar como ímãs. Nos mercados financeiros, certos níveis de preços podem atrair uma quantidade desproporcional de atividades de compra e venda, não apenas por causa da análise técnica, mas por causa da psicologia humana.
A justificativa: Grandes pedidos, níveis de stop-loss e take-profit podem se agrupar em torno desses grandes números, o que pode reforçar o suporte ou a resistência. Esse comportamento de autorreforço é uma das razões pelas quais essas rejeições podem se tornar significativas para os comerciantes.
O que os traders procuram: Os comerciantes geralmente observam como o preço se comporta à medida que se aproxima de um número redondo. O mercado pode hesitar, rejeitar o nível ou ultrapassá-lo com impulso. Várias rejeições de pavio no mesmo nível podem ter mais peso do que uma única.
Fonte: GO Markets | Apenas exemplo educacional.
Como funciona: Quando o preço se aproxima de um número redondo vindo de baixo, alguns traders observam mechas superiores longas, a fina linha vertical acima do corpo da vela. Um longo pavio superior significa que o preço atingiu esse nível, mas os vendedores intervieram agressivamente e o empurraram para baixo antes que a vela se fechasse.
Uma rejeição de um pavio pode ser notável. Três em um cluster podem ser mais significativos. Alguns traders usam essa rejeição acumulada como parte do caso de uma configuração curta (venda) nesse nível.
O que assistir: Os níveis psicológicos também podem atuar como ímãs na direção oposta. Se o preço ultrapassar com convicção, o nível poderá então atuar como suporte. Um fechamento decisivo acima do nível, em vez de apenas uma quebra do pavio, pode ser um sinal precoce de que a configuração de rejeição não está mais se mantendo.
7. Rotação setorial (o jogo da temporada econômica)
Essa é uma estratégia macro. À medida que o cenário econômico muda, o capital pode passar de setores de maior crescimento para setores mais defensivos e vice-versa. Nem todas as partes do mercado de ações se movem na mesma direção ao mesmo tempo.
A justificativa: Em uma economia em desaceleração, os gastos discricionários podem enfraquecer, enquanto a demanda por serviços essenciais pode permanecer mais estável. Os investidores podem alternar o capital entre os setores adequadamente.
O que os traders procuram: Com CFDs, alguns negociadores expressam essa visão por meio de força relativa, expondo-se a um setor mais forte e reduzindo ou compensando a exposição a um setor mais fraco.
Fonte: GO Markets | Apenas exemplo educacional.
Como funciona: Durante uma fase de crescimento, quando a economia está se expandindo, os investidores tendem a preferir setores voltados para o crescimento, como a tecnologia. À medida que o ambiente econômico muda, talvez devido ao aumento das taxas de juros, à desaceleração dos lucros ou ao aumento do risco de recessão, um ponto de rotação pode surgir.
Na fase de desaceleração, o padrão pode se reverter. A tecnologia pode enfraquecer, enquanto as concessionárias podem se fortalecer, à medida que os investidores transferem capital para setores defensivos e geradores de renda. Os sinais iniciais podem incluir um desempenho relativamente baixo em setores de crescimento combinado com uma força incomum nas defensivas.
O que assistir: A rotação de setores geralmente não é um evento noturno. Normalmente se desenrola ao longo de semanas a meses. Rastrear a relação entre dois setores, geralmente mostrada em um gráfico de força relativa, pode tornar essa mudança visível antes que se torne óbvia em termos absolutos de preço.
Por que o gerenciamento de riscos é o motor da sobrevivência
A mudança da manchete é uma coisa. A implicação do mercado para sua conta é outra. Se você não gerencia a mecânica, a estratégia não importa.
Como os CFDs são negociados com margem, um pequeno movimento do mercado pode ter um impacto enorme na conta. Se a alavancagem for muito alta, até mesmo uma pequena oscilação pode desencadear uma chamada de margem ou o fechamento automático da posição, dependendo dos termos do provedor. Isso não é um risco teórico. É um motivo comum pelo qual os novos negociadores perdem mais do que esperavam em uma negociação direcionalmente correta.
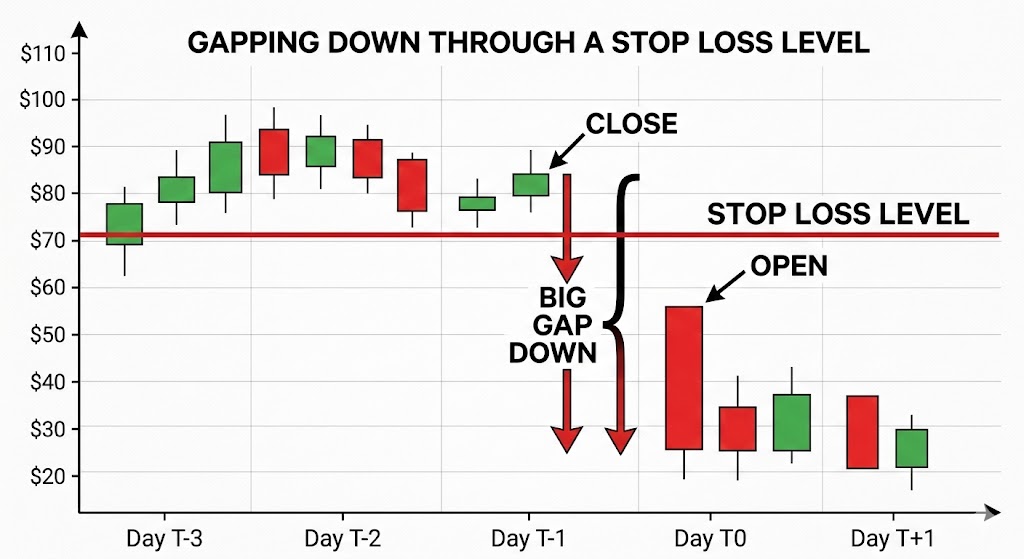
O mercado nem sempre se move em linha reta. Às vezes, diferenças de preço de um nível para outro, especialmente após um fim de semana ou um grande evento noticioso e, nessas condições, um stop-loss pode não ser preenchido com o preço exato solicitado. Isso é conhecido como deslizamento. Essa é uma das razões pelas quais grandes posições podem acarretar riscos adicionais em grandes anúncios.
Conclusão
O veículo é poderoso, mas o manual é o que ajuda a mantê-lo na estrada.
A negociação óbvia geralmente já está cotada. O que importa mais é entender qual condição de mercado está à sua frente. É uma tendência, uma variedade, um sucesso ou simplesmente uma reação a uma manchete?
Os leitores que avaliam produtos alavancados geralmente se concentram no tamanho da posição, nos limites de risco e na divulgação do produto antes de decidir se o produto é apropriado para eles. As manchetes continuarão mudando. A matemática do gerenciamento de riscos não.
Isenção de responsabilidade: Este artigo é apenas para informações gerais e tem fins educacionais. Ele explica conceitos comuns de negociação e comportamentos de mercado e não constitui um conselho sobre produtos financeiros, uma recomendação ou um sinal de negociação. Todos os exemplos são meramente ilustrativos e não levam em consideração seus objetivos, situação financeira ou necessidades. Os CFDs são produtos complexos e alavancados que apresentam um alto nível de risco. Antes de agir, considere o PDS e o TMD e se negociar CFDs é apropriado para você. Procure aconselhamento independente, se necessário. O desempenho passado não é um indicador confiável de resultados futuros.
A volatilidade tem um jeito de aparecer sem ser convidada.
Um dia, o ASX está flutuando silenciosamente... e no outro, os requisitos de margem aumentam, as paradas não são preenchidas onde o esperado e os portfólios abrem com lacunas desconfortáveis da noite para o dia.
Se você está procurando por respostas, não está sozinho. Algumas das perguntas mais pesquisadas sobre volatilidade entre os negociadores australianos estão relacionadas a chamadas de margem, derrapagens, lacunas noturnas, fundos negociados em bolsa (ETFs) alavancados e ferramentas como o Average True Range (ATR).
Aqui está o que está acontecendo.
Por que isso importa agora
Os mercados globais se tornaram mais sensíveis às taxas de juros, dados de inflação, geopolítica e fluxos impulsionados pela tecnologia. Quando a liquidez diminui e a incerteza aumenta, as oscilações de preços aumentam. Isso é volatilidade.
E a volatilidade não afeta apenas a direção dos preços, ela muda a forma como as negociações são executadas, quanto capital é necessário e como o risco se comporta sob a superfície.
Tradução: A volatilidade não se trata apenas de movimentos maiores, mas sim de movimentos mais rápidos e menor liquidez - é aí que a mecânica da negociação é mais importante.
Por que meu corretor aumentou os requisitos de margem?
Uma das perguntas mais pesquisadas sobre volatilidade é por que os requisitos de margem aumentam sem aviso prévio.
Quando os mercados se tornam instáveis, os corretores podem aumentar os requisitos de margem em contratos por diferença (CFDs) e outros produtos alavancados. Grandes oscilações de preço podem aumentar o risco de contas entrarem em patrimônio líquido negativo, portanto, aumentar os requisitos de margem reduz a alavancagem disponível e pode ajudar a gerenciar a exposição em condições extremas.
O que isso pode significar na prática
-Uma chamada de margem pode ocorrer mesmo que o preço não tenha se movido significativamente. -A alavancagem efetiva pode cair rapidamente. -As posições podem precisar ser reduzidas em curto prazo.
Os ajustes de margem geralmente são uma resposta à mudança do risco de mercado, não uma decisão aleatória. Em mercados altamente voláteis, é prudente presumir que as configurações de margem podem mudar rapidamente, portanto, muitos negociadores optam por revisar os tamanhos das posições e os buffers disponíveis à luz desse risco.
O que é deslizamento e por que meu batente não preencheu meu preço?
Outro tópico pesquisado com frequência é o deslizamento.
A derrapagem pode ocorrer quando uma ordem de parada é acionada e executada no próximo preço disponível. O resultado pode depender do tipo de pedido, da liquidez do mercado e das lacunas. Em mercados calmos, a diferença pode ser pequena, enquanto em mercados rápidos, os preços podem ultrapassar o nível de parada.
Ilustração da diferença de preço em relação ao nível de stop-loss | GO Markets
Os drivers comuns incluem
-Principais divulgações econômicas ou de resultados. - Liquidez escassa. - Pisos de parada lotados. - Sessões noturnas.
As ordens de stop-loss geralmente priorizam a execução em vez da certeza do preço e, durante períodos de alta volatilidade, essa distinção se torna importante. Ajustar o tamanho da posição e colocar paradas com referência ao movimento típico de preços pode ser mais eficaz do que simplesmente apertar as paradas em condições instáveis.
Como faço para gerenciar lacunas noturnas no ASX?
A Austrália negocia enquanto os Estados Unidos dormem e vice-versa. Essa diferença de fuso horário é, infelizmente, uma das razões pelas quais o risco de lacuna noturna é frequentemente pesquisado pelos comerciantes australianos. Se os mercados dos EUA caírem drasticamente, o ASX poderá abrir em baixa na manhã seguinte, sem oportunidade de sair entre o fechamento e a abertura.
Exemplos de abordagens de gerenciamento de risco que os traders do mercado podem usar incluem
-Cobertura de índices usando futuros ASX 200 ou CFDs*. -Cobertura parcial durante eventos de alto risco. -Reduzir a exposição antes dos principais anúncios macro.
O hedge pode compensar parte de um movimento, mas introduz um risco básico, pois as ações individuais podem não se mover de acordo com o índice mais amplo.
Não há proteção perfeita, apenas compensações entre custo, complexidade e redução de riscos.
*Os CFDs são instrumentos complexos e apresentam um alto risco de perda de dinheiro devido à alavancagem.
Quais são os principais riscos dos ETFs alavancados ou inversos em mercados voláteis?
Os ETFs alavancados e inversos são frequentemente pesquisados durante períodos de maior volatilidade.
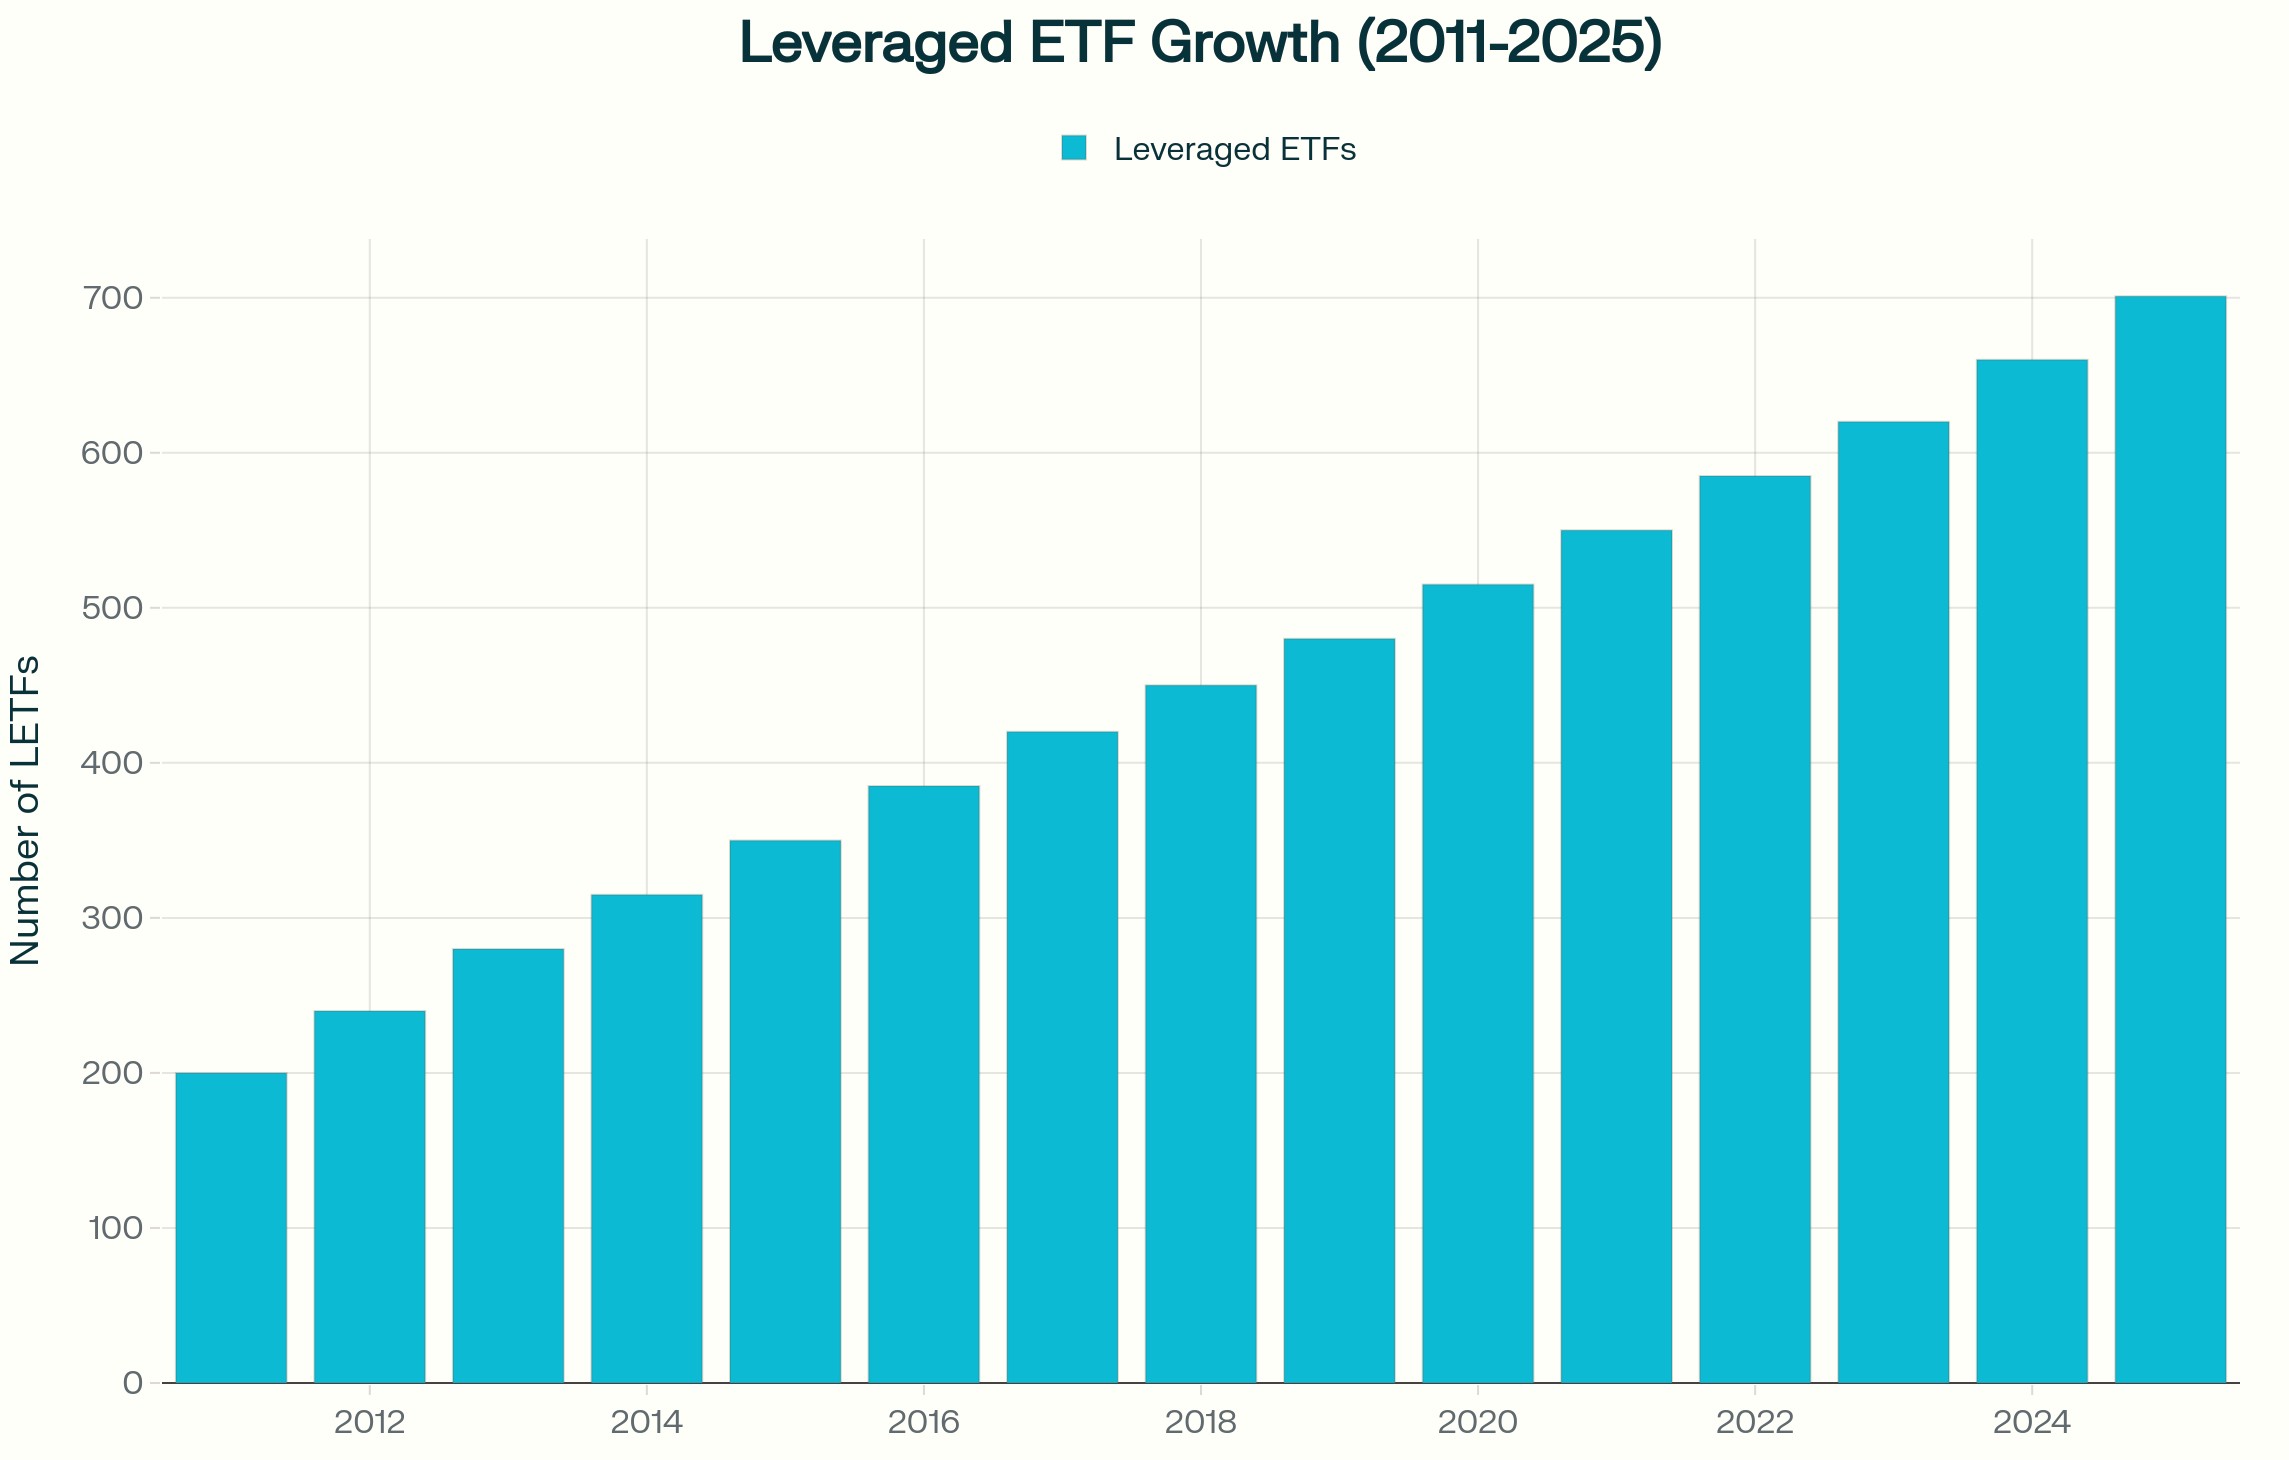
Embora esses produtos normalmente sejam reinicializados diariamente, eles visam gerar um múltiplo do retorno diário do índice, não seu retorno de longo prazo. Em um mercado volátil e lateral, a composição diária pode corroer o valor, mesmo que o índice termine próximo ao nível inicial.
Crescimento alavancado do ETF (2011—2025) | Fonte: Investing.com
Isso ocorre porque os ganhos e as perdas se acumulam de forma assimétrica. Uma queda de 10 por cento exige um ganho de mais de 10 por cento para se recuperar. Quando esse efeito é multiplicado diariamente, os resultados podem divergir materialmente do índice subjacente ao longo do tempo.
Esses instrumentos podem ser usados taticamente por alguns participantes do mercado. Eles geralmente não são projetados como ferramentas de hedge de longo prazo e entender sua estrutura é essencial antes de usá-los em uma estratégia.
Como o ATR pode ser usado para informar o posicionamento da parada??
O intervalo médio real (ATR) é um indicador comumente usado para medir a volatilidade.
O ATR estima o quanto um ativo normalmente se move em um determinado período, incluindo lacunas. Em vez de definir um stop em uma porcentagem arbitrária, alguns traders fazem referência ao ATR e colocam os stops em um múltiplo, como duas ou três vezes o ATR, para refletir as condições prevalecentes.
Quando a volatilidade aumenta, o ATR se expande e isso pode implicar paradas maiores ou tamanhos de posição menores para que o risco geral permaneça constante. A mudança é deixar de perguntar: “Até onde estou disposto a perder?” a perguntar: “O que é um movimento normal nas condições atuais?”
Considerações práticas em mercados voláteis
Durante períodos de elevada volatilidade, os traders podem considerar
Permitindo a possibilidade de mudanças de margem
Dimensionar posições de forma conservadora se a volatilidade aumentar
Reconhecendo que as ordens de stop-loss não garantem um preço de saída específico
Analisando a exposição antes de grandes eventos econômicos
Entendendo a mecânica diária de redefinição de ETFs alavancados
Usando medidas de volatilidade, como ATR, para informar o posicionamento da parada
Manter amortecedores de caixa adequados
A volatilidade não recompensa apenas a previsão. A preparação e a conscientização sobre os riscos podem ajudar os negociadores a entender os riscos potenciais, mas os resultados permanecem imprevisíveis.
O que isso significa para os comerciantes australianos
Os mercados australianos enfrentam considerações estruturais específicas em comparação com os mercados asiático e americano. O risco de lacuna noturna é influenciado pelo horário de negociação dos EUA e índices pesados de recursos, como o ASX, podem responder rapidamente aos movimentos dos preços das commodities e aos dados da China. A exposição cambial, incluindo movimentos de AUD e dólar americano (USD), pode adicionar outra camada de variabilidade.
A volatilidade não é uniforme entre as regiões. Ele se comporta de maneira diferente dependendo da estrutura do mercado e da profundidade da liquidez.
Perguntas frequentes sobre volatilidade
O que causa picos repentinos na volatilidade do mercado? Decisões sobre taxas de juros, dados de inflação, desenvolvimentos geopolíticos, surpresas de lucros e restrições de liquidez são gatilhos comuns.
Por que os corretores aumentam a margem em mercados voláteis? Reduzir a exposição à alavancagem e gerenciar o risco quando as oscilações de preço aumentam.
As ordens de stop-loss podem falhar durante a volatilidade? Eles podem sofrer derrapagens se os mercados ultrapassarem o nível de parada, o que significa que a execução pode ocorrer a um preço pior do que o esperado. Em mercados rápidos ou ilíquidos, essa diferença pode ser significativa.
Os ETFs alavancados são adequados para cobertura de longo prazo? Eles geralmente são estruturados para exposição de curto prazo devido a reinicializações diárias. Se eles são apropriados depende de seus objetivos, situação financeira e tolerância ao risco.
Como a volatilidade pode ser medida antes de fazer uma negociação? Ferramentas como ATR, indicadores de volatilidade implícitos e análise de intervalo histórico podem ajudar a quantificar as condições prevalecentes.
Aviso de risco: períodos de maior volatilidade podem levar a movimentos rápidos de preços, mudanças de margem e execução a preços diferentes dos esperados. Ferramentas de gerenciamento de risco, como ordens de stop-loss e indicadores de volatilidade, podem ajudar na avaliação das condições do mercado, mas não podem eliminar o risco de perda, especialmente ao usar produtos alavancados.
We are less than three weeks away from the ASX earning season and we are less than two weeks away from the earnings season in the US. So, we need to start prepping for trades and opportunities now. First and foremost, do not forget that confession season is well and truly upon us here in Australia.
Downgrades clearly have been coming from the discretionary sector; we've even seen companies hit the wall with the likes of Booktopia going into administration. There are some clear thematics that are growing in the Australian market. Energy, while the worst performing sector for the financial year 2024, may actually show you that earnings were slightly above expectation on higher than expected oil prices.
Materials led in the main by BHP, Rio and FMG Have once again benefited from higher than expected iron ore prices. It also benefited from a lower than expected AUD/USD where average FX prices were expected to be between $0.68 and $0.73 but instead have averaged between $0.63 and $0.67. What we're looking for is operational costs, overall margins and forward looking guidance, something that these firms have lacked in the last three financial updates.
Watch very closely for the excitement that will come from things like copper at the expense of the issues that are facing nickel lithium and other transition metals that have had really tough periods in FY24. Moving to the banks this is a sector people argue is fully valued. It's not hard to argue when through the financial year CBA made record all time highs several times and is still within a whisker of its record all time high.
Higher interest rates will indeed improve net interest margins. However, the unknown question and what we need to see at its August full year earnings is the impact higher rates are having on bad and doubtful debts, the possible increase in provisioning and more importantly the impact its having on new loans and refinancing. There is an argument to be made that banking is possibly fully priced and no matter what result is delivered won't necessarily create a leg further higher.
Finally, you can't go past consumer staples and discretionary. Retail sales numbers over the last 18 months have actually shown discretionary spending At or above 2022 levels although month on month figures have been erratic. The question that will come for discretionary spending is margins and how much sales revenue translates to the bottom line in earnings and profit.
Staples on the other hand have seen consistent movement on the revenue line but the question will be the margin and after the very targeted senate inquiry into supermarkets any sign profits are above trend may actually be met with concern as geopolitics raises its head. 33 times in 2024 the US 500 and the Tech 100 have made record highs – can it continue? Look into the US and the ending season that it is about to undertake. We have to look at several core thematics that are likely to be raised.
Artificial Intelligence (AI) The question you’ve got to ask is: is the time frame long or short? We raised this Mag 7 stocks etc Microsoft, Amazon, Alphabet, apple have clear potential. They are evolving their business models and see the integration of AI as the future of their individual businesses.
That will likely come up in their numbers but it will come with operational and initial upfront costs as the integration of AI begins. This is all long term may not fully capture short term opportunities which is still presenting very much in the semiconductor providers. NVIDIA and Advanced Micro Devices are taking full advantage and monetizing the compute cycle.
This clearly won't be forever because it will go from semiconductors to infrastructure to software and therefore the flows will move back towards the bigger end of town but overall the AI thematic still flows towards the semiconductors for now and that's likely to be shown in the earnings season that's coming. Data Centres That brings us to data centres because the potential for ensuring AI requires a heck of a lot of storage and a heck of a lot of processing. There are estimates the data centres will need to grow by 420% in Europe and 250% in the US by 2035 based on the rate of growth in AI right now.
Therefore, we need to watch providers like Dell Technologies and Intel which are big providers of data centres currently. We think the market hasn’t fully appreciated DC needs in the AI revolution. Cybersecurity The final key theme in the AI data centre technology space that we also think needs to be watched is cyber security.
It's been something along the lines of a 70% increase in ransomware attacks over the past 24 months. The regulatory requirements and the budgets required to deal with these increased threats is only just beginning. That brings players like Fortinet to the fore IT programmes and it's pensively to develop programs for enterprise makes it an interesting one going forward.
GLP-1 ‘Weight Loss’ Medicines Another theme of being a really strong driver of the S&P 500 is the rise of GLP-1 medicines. The weight loss craze that has come off the back of this Amazon has been incredible. Initially obviously developed for diabetes but having an additional effect of weight loss has created a product out of nowhere.
Eli Lilly and Co is a key player in this space with its GLP one class medicines already approved by the FDA. It's been launched in the US and its oral intake has posted adoption. It is not the only one in this space but shows very clearly the impact weight loss medicines are having on earnings.
The caveat we have though is side effects and long term impacts are still being found and could be said as a capping issue on price. Whatever way you look at it the US dating season however will be incredibly exciting and it is the reason The US markets continue to see huge capital inflows as they are much more exciting in this current environment than traditional value markets such as Australia.
A temporada de resultados de abril nos EUA está chegando a um mercado que quer mais do que uma boa história. JPMorgan já estabeleceu um alto padrão com um resultado forte, e a atenção agora está se voltando para a sala de máquinas do S&P 500: infraestrutura de IA, na qual três empresas estão no centro dessa história.
Por que essa janela de ganhos é importante para a IA
Microsoft, Alphabet e NVIDIA não são apenas participantes do ciclo de IA, elas estão construindo a arquitetura física e de software da qual outras empresas dependem: os chips, as regiões da nuvem, os modelos e as ferramentas. Se esses gastos gerarem retornos, os primeiros sinais podem começar a aparecer em seus resultados trimestrais nas próximas semanas.
Cada empresa representa um teste diferente.
Microsoft: Se a adoção da IA corporativa está se traduzindo em expansão de receita e margem
Alfabeto: Se possuir a pilha completa, de chips à nuvem e distribuição, é uma vantagem duradoura ou simplesmente uma posição cara a ser defendida
NVIDIA: Se o ciclo de hardware ainda está se mantendo, acelerando ou começando a se estabilizar
Em 2026, a questão não é mais se o investimento em IA está acontecendo, os compromissos de capital são substanciais e já declarados publicamente. A questão é se esses gastos estão gerando retornos com rapidez suficiente para justificar a escala dessas apostas.
IMPORTANT: REPORTING SCHEDULES CAN CHANGE WITHOUT NOTICE. REPORTING DATES AND RELEASE TIMES ARE FROM COMPANY INVESTOR RELATIONS CALENDARS WHERE MARKED CONFIRMED; OTHERWISE THEY ARE GO MARKETS ESTIMATES. CONSENSUS EPS, REVENUE AND ANALYST-RANGE DATA ARE FROM THIRD-PARTY MARKET CONSENSUS SOURCES, AS OF 16 APRIL 2026 (AEST). COMPANY GUIDANCE, BACKLOG AND OPERATING METRICS ARE FROM THE LATEST COMPANY FILINGS OR RESULTS PRESENTATIONS UNLESS STATED OTHERWISE. FIGURES AND SCHEDULES MAY CHANGE WITHOUT NOTICE.
$MSFT| Q1 2026 REPORTING PERIOD
Microsoft Corporation
NASDAQ | Technology | 29 Apr 2026
Confirmed
Global Release Countdown (AMC)
00:00:00:00
Consensus EPS
US$4.04
Consensus Revenue
US$81.40bn
AU/ASIA30 Apr | 6:05 am
US/LATAM29 Apr | 4:05 pm
Market Intelligence: $MSFT
Analysis: Microsoft price drivers and scenarios
Azure Growth Target
37-38%
Constant currency projection
AI Contribution
+6-8 pts
Azure revenue from AI services
FY26 Capex
US$146bn
Total infrastructure spending
AVG
LOW US$3.86AVG US$4.04HIGH US$4.14
Microsoft is being tested on a specific question: can it turn heavy AI spending into margin expansion? A result above US$4.14 could ease concerns over "capex fatigue" and demonstrate whether Azure growth is re-accelerating alongside enterprise AI adoption.
Factors that could move the markets
Azure growth rate
Watch if constant-currency growth re-accelerates above 39%, suggesting AI workloads are filling new capacity rather than sitting idle.
Signal: Capacity Utilisation
Workplace agent adoption
The shift to autonomous agents is central. Clear enterprise uptake in Dynamics 365 supports the high-tier subscription thesis.
Signal: Software Monetisation
Maia 200 cost savings
If the in-house AI chip is lowering inference costs at production levels, gross margins may start to recover from recent compression.
Watch: Gross Margin Recovery
Regulatory backdrop
Ongoing scrutiny of cloud bundling practices remains a potential headwind; management commentary here is vital for the long-term view.
Watch: Bundling Compliance
Sentiment Analysis · Microsoft Corp.
Interactive scenario analysis: $MSFT
Select earnings outcome
AI Scaling Proof
Strong result, backed by real AI progress
EPS above US$4.14 and Azure re-acceleration above 39% could support the view that AI spending is starting to translate into commercial returns. Workplace Agents show measurable ROI and FY26 guidance is raised.
EPS Outcome
Above US$4.14
Cloud Signal
Accelerating
Guidance
Raised
Possible reaction
Strong rally
Sources & Data Methodology
Sources: Reporting dates and release times are from company investor relations calendars where marked Confirmed; otherwise they are GO Markets estimates. Consensus EPS, revenue and analyst-range data are sourced from Bloomberg and Earnings Whispers, as at 16 April 2026 (AEST). Company guidance, backlog and operating metrics are sourced from the latest company filings or results presentations. Any scenario analysis reflects GO Markets analysis. Figures and schedules may change without notice.
Expanded Coverage
Beyond the chipmakers
As the "show me the money" year unfolds, discover how AI demand is impacting Tesla, NextEra, and Exxon.
Alphabet has transformed from a search business into a sprawling AI infrastructure play, and this result will test whether that transformation is delivering. The US$185 billion capex forecast for 2026 is extraordinary, close to double last year's spending.
EPS is expected to decline slightly year on year, precisely because that infrastructure spending is consuming capital. The question is whether Google Cloud's growth is fast enough to show a credible path back to margin recovery, and whether Ironwood, the seventh-generation custom AI chip, is proving its cost-per-query advantage at scale.
$GOOGL| Q1 2026 REPORTING PERIOD
Alphabet Inc.
NASDAQ | Technology | 29 Apr 2026
Confirmed
Global Release Countdown (AMC)
00:00:00:00
Consensus EPS
US$2.64
Consensus Revenue
US$92.14bn
AU/ASIA30 Apr | 6:30 am
US/LATAM29 Apr | 4:30 pm
Market Intelligence: $GOOGL
Analysis: Alphabet price drivers and scenarios
Cloud growth
48% YoY
Compared with last quarter
Ironwood TPU
10x peak
Vs previous-generation chip
2026 Capex
US$185bn
Double last year's spending
AVG
LOW US$2.50AVG US$2.64HIGH US$2.80
Alphabet has shifted to being viewed as a broader AI infrastructure play. The question is whether Cloud growth can support a path back to margin recovery while the massive US$185bn infrastructure buildout absorbs capital.
Factors that could move the markets
Google Cloud momentum
Markets are watching if the 48% growth rate holds, specifically among customers using Ironwood TPUs for large-scale AI.
Signal: Enterprise AI Adoption
Search & AI overview
If compute-intensive AI summaries are monetising through ads, it supports core search economics in the AI era.
Focus: Search Economics
Capex & margin trajectory
With free cash flow under pressure from US$185bn capex, markets want to know when infrastructure investment will moderate.
Watch: Spending Ceiling
DOJ antitrust risk
Management commentary on the legal timeline for Chrome or Android divestiture appeals will influence how risk is priced.
Watch: Regulatory Remedies
Sentiment Analysis · Alphabet Inc.
Interactive scenario analysis: $GOOGL
Select earnings outcome
Efficiency Proof
Ironwood efficiency drives upside
EPS above US$2.80 and cloud growth above 45% suggest Ironwood is cutting costs and strengthening Google’s advantage faster than expected.
EPS outcome
Above US$2.80
Cloud Signal
Strong growth
Waymo
Accelerating
Reaction
Sentiment improves
Sources & Data Methodology
Sources: Reporting dates and release times are from company investor relations calendars where marked Confirmed; otherwise they are GO Markets estimates. Consensus EPS, revenue and analyst-range data are sourced from Bloomberg and Earnings Whispers, as at 16 April 2026 (AEST). Company guidance, backlog and operating metrics are sourced from the latest company filings or results presentations. Any scenario analysis reflects GO Markets analysis. Figures and schedules may change without notice.
NVIDIA: the hardware cycle read through
NVIDIA is no longer simply a chip company. It has become what analysts now describe as the central bank of compute, the entity whose product determines how much AI capacity the world can actually deploy.
The upcoming Q1 FY2027 result will test whether the new Vera Rubin R100 GPU architecture, which entered mass production ahead of schedule, is already contributing to revenue, and whether NVIDIA can sustain gross margins above 75% as inference, rather than training, becomes the dominant workload. Inference is more competitive and more price-sensitive than training, so margin resilience here matters.
$NVDA| Q1 2026 REPORTING PERIOD
NVIDIA Corporation
NASDAQ | Semiconductors | 20 May 2026
Confirmed
Global Release Countdown (AMC)
00:00:00:00
Consensus EPS
US$1.70
Consensus Revenue
US$78.42bn
AU/ASIA21 May | 6:30 am
US/LATAM20 May | 4:30 pm
Market Intelligence: $NVDA
Analysis: NVIDIA price drivers and scenarios
Revenue growth
73% YoY
Last quarter benchmark
Data centre share
91%+
Share of total revenue
Rubin R100
In production
Mass production began April 2026
AVG
LOW US$76bnAVG US$78bnHIGH US$81bn+
NVIDIA’s outlook depends on whether Rubin R100 can keep gross margins above 75% as inference becomes a bigger part of demand. Because inference is more price-sensitive than training, margins are the key test.
Factors that could move the markets
Rubin ramp-up
Watch whether Rubin production can scale smoothly without disrupting the Blackwell transition.
Signal: supply chain continuity
Inference margins
The key test is whether NVIDIA can keep gross margins above 75% as inference revenue grows.
Signal: pricing power holds up
Sovereign AI demand
Government-backed investment in Europe and the Middle East could broaden the base beyond hyperscalers.
Signal: market expansion
CUDA regulatory risk
Any US or European scrutiny of NVIDIA’s software advantage could move the stock regardless of the revenue result.
Signal: software moat under review
Sentiment Analysis · NVIDIA Corp.
Interactive scenario analysis: $NVDA
Select earnings outcome
Rubin ramp supports growth
Rubin ramp supports growth
Revenue above US$81 billion may suggest the Rubin ramp is tracking ahead of expectations. That could support the view that AI demand is broadening into sovereign AI and enterprise markets, helping extend visibility into 2027.
Revenue Outcome
Above US$81bn
Gross Margin
Above 75%
Workload
Inference strong
Reaction
Positive read-through
Sources & Data Methodology
Sources: Reporting dates and release times are from company investor relations calendars where marked Confirmed; otherwise they are GO Markets estimates. Consensus EPS, revenue and analyst-range data are sourced from Bloomberg and Earnings Whispers, as at 16 April 2026 (AEST). Company guidance, backlog and operating metrics are sourced from the latest company filings or results presentations. Any scenario analysis reflects GO Markets analysis. Figures and schedules may change without notice.
Thematic Risks
What could shift the picture
Three risks could change the narrative regardless of how the numbers print. Each one is worth understanding before the results land.
Capex fatigue
If both Microsoft and Alphabet report in line or below expectations while reaffirming enormous spending plans, the market may start pricing the risk that AI monetisation is slower than the spending implies. That is not a stock-specific concern. It would be a broader de-rating event, affecting the valuations of companies across the technology sector.
Regulatory escalation
The FTC investigation into Microsoft, the DOJ case against Alphabet, and emerging EU scrutiny of NVIDIA's CUDA software ecosystem are all active. A material legal development before the earnings calls could overshadow the financial results entirely. Regulatory risk in this sector is not theoretical. It is live and moving.
Competition from custom silicon
Microsoft's Maia 200 chip, Alphabet's Ironwood TPU, Amazon's Trainium and Meta's custom accelerators are all reducing how much the large cloud companies depend on NVIDIA hardware. If any of these companies signals a meaningful shift in its GPU procurement plans, that could create uncertainty around NVIDIA's forward order book.
Note: These systemic risks represent thematic pivots that may influence risk appetite independently of headline EPS beats.
The Bottom Line
The 2026 reality check
Microsoft and Alphabet report on the same evening, 29 April. NVIDIA follows in late May. Together, they offer the clearest read yet on whether the AI infrastructure buildout is generating returns fast enough to justify the extraordinary scale of capital being committed.
$MSFT
AI spend is shifting from cost to competitive advantage. The question is whether margins can follow.
$GOOGL
Vertical integration from chips to search to cloud may prove to be a moat, or an expensive position to defend.
$NVDA
This is the pulse of the AI hardware cycle, and a test of whether Rubin can keep the supercycle alive into 2027.
Taken together, they offer a read on a market that looks more physical, more capital-intensive and, for many traders, more real.
Your next earnings setup starts here
Stay ahead of major beats, misses, and market surprises. Log in to your terminal, open a new account, or explore our dedicated earnings academy.
April’s US earnings season is arriving in a market that is asking harder questions. It is no longer enough for companies to tell a good story. Traders want to see whether the physical side of the next cycle is turning into real revenue, steadier margins and clearer guidance.
That is why Tesla, NextEra Energy and Exxon Mobil matter this month. Each sits close to a theme the market is trying to price right now: autonomy, electricity demand and oil supply risk. They are very different businesses, but together they offer a useful read on where attention may be shifting when the market wants something more tangible.
In 2026, those signals are colliding with a high-friction backdrop:
AI power demand is pushing utilities, storage and grid capacity into focus
Tesla needs to show that autonomy and energy can support the next chapter beyond EV margins
Oil supply risk has pushed energy security back into the conversation
Why this part of the market matters
The broader theme here is simple. AI still matters. Growth still matters. But this earnings season may also test the companies supplying the power, infrastructure and fuel behind that story.
For beginner to intermediate traders, this matters because these stocks can move for very different reasons. Tesla can trade on margins and product narrative. NextEra can trade on power demand and capital spending plans. Exxon can move with crude, refining margins and buyback confidence. Looking at them together gives traders a clearer way to think about how the market is pricing the real economy side of the 2026 story.
IMPORTANT: REPORTING SCHEDULES CAN CHANGE WITHOUT NOTICE. REPORTING DATES AND RELEASE TIMES ARE FROM COMPANY INVESTOR RELATIONS CALENDARS WHERE MARKED CONFIRMED; OTHERWISE THEY ARE GO MARKETS ESTIMATES. CONSENSUS EPS, REVENUE AND ANALYST-RANGE DATA ARE FROM THIRD-PARTY MARKET CONSENSUS SOURCES, AS OF 14 APRIL 2026 (AEST). COMPANY GUIDANCE, BACKLOG AND OPERATING METRICS ARE FROM THE LATEST COMPANY FILINGS OR RESULTS PRESENTATIONS UNLESS STATED OTHERWISE. FIGURES AND SCHEDULES MAY CHANGE WITHOUT NOTICE.
$TSLA| Q1 2026 REPORTING PERIOD
Tesla Inc.
NASDAQ | Consumer Discretionary | 23 Apr 2026
Confirmed
Global Release Countdown (AMC)
00:00:00:00
Consensus EPS
US$0.41
Consensus Revenue
US$22.26bn
AU/ASIA24 Apr | 6:05 am
US/LATAM23 Apr | 4:05 pm
Market Intelligence: $TSLA
Analysis: Tesla price drivers and scenarios
Auto Gross Margin
17-19%
Target floor, excl. credits
Megapack Growth
+25% YoY
Projected energy deployment
Analyst range
US$0.32-0.48
EPS estimate range
AVG
LOW US$0.32AVG US$0.41HIGH US$0.48
The US$0.16 analyst range shows there is still a lot of uncertainty. The main question is how weaker vehicle deliveries compare with stronger, higher-margin energy storage contributions. A result above US$0.48 would suggest the autonomy and battery story is improving faster than the bear case expects.
Key factors that could move the result
Automotive gross margin
This is the most important number for Tesla’s core business. Markets want to see whether price cuts have started to settle, or whether margins are still under pressure.
Benchmark: 17% (excluding credits)
Energy storage (Megapacks)
This is the more durable growth story. Strong Megapack deployment and battery margins could help offset weaker vehicle deliveries
Focus: Storage growth versus pressure in the auto business
Full Self-Driving (FSD) & Robotaxi
This is the main narrative driver. Markets will watch for updates on FSD adoption and the robotaxi timeline to judge whether the move towards “physical AI” is becoming more credible.
Watch: Timing for next-generation autonomy technology
Regulatory credits
This is a quality check on the result. If EPS is boosted too much by credit sales, some traders may see the beat as less durable.
Watch: How much credit sales contribute to final EPS
Trade Execution: $TSLA
Earnings reaction framework: Q1 2026
Bull case
EPS above US$0.45, energy margins at 20%+ | FSD take rates rising
The result clears the top-tier analyst range. Commentary focuses on FSD scaling and Megapack production ramps rather than vehicle discounting. FY26 guidance is reaffirmed.
Possible reaction: stronger momentum, with short covering adding support
Base case
EPS between US$0.38 and US$0.43, auto margins stable | Near target
The result is close to expectations, but there is no major surprise from the energy business. The market stays focused on the robotaxi timeline. The initial move may be limited if the product mix looks unchanged.
Possible reaction: range-bound trading or a muted early response
Bear case
EPS below US$0.35, auto margins drop below 16% | Signs of FSD delays
The result misses even cautious expectations. Rising inventory suggests more discounting may be needed. The market starts to question whether the level of spending on AI and autonomy is too high.
Possible reaction: rotation out of the stock, especially if growth confidence weakens
Sentiment Analysis · Tesla Inc.
Interactive scenario analysis: $TSLA
Select earnings outcome
Growth momentum
Strong result, helped by energy and FSD
FSD and Energy do better than expected, which helps offset weaker car deliveries. Management gives the market more confidence that autonomy is getting closer to real revenue. Auto margins staying above 17% would also help.
EPS Outcome
Above US$0.45
Energy Signal
On track
Margins
At or above 17%
Likely Reaction
Strong rally
Sources & Data Methodology
Sources: Reporting dates and release times are from company investor relations calendars where marked Confirmed; otherwise they are GO Markets estimates. Consensus EPS, revenue and analyst-range data are sourced from Bloomberg and Earnings Whispers, as at 14 April 2026 (AEDT). Company guidance, backlog and operating metrics are sourced from the latest company filings, results presentations or investor relations materials unless stated otherwise. Any scenario analysis reflects GO Markets analysis. Figures and schedules may change without notice.
From autonomy to electricity
If Tesla is the market’s test of whether physical AI can become a business, NextEra is a test of whether the power buildout behind AI is starting to show up more clearly in utility economics.
That is what makes the shift from Tesla to NextEra interesting. One is about ambition and platform narrative. The other is about power, contracts, infrastructure and return on capital.
$NEE| Q1 2026 REPORTING PERIOD
NextEra Energy, Inc.
NYSE | Utilities | 24 Apr 2026
Confirmed
Global Release Countdown (BMO)
00:00:00:00
Consensus EPS
US$0.91
Consensus Revenue
US$7.17bn
AUSTRALIA (AEST)24 Apr | 9:35 pm
ASIA (UTC+8)24 Apr | 7:35 pm
Market Intelligence: $NEE
Analysis: NEE price drivers and scenarios
Backlog Conversion
~29.8 GW
Energy Resources total backlog
Growth Framework
8%+ Annual
Adjusted EPS growth through 2032
Analyst Range
US$0.88 - 1.06
Q1 estimate spread
AVG
LOW US$0.88AVG US$0.92HIGH US$1.06
Against the 2026 ‘year of proof’ theme, the key issue is whether upcoming results turn strategic announcements into clearer execution signals. NextEra is a test of whether the power buildout behind AI is starting to show up clearly in utility economics.
Trade Execution: $NEE
Earnings reaction framework: Q1 2026
Key signals to watch
Contract Quality
Watch for movement from customer interest (20+ GW) to signed large load agreements.
Signal: Large load monetization
Natural Gas Hub Strategy
Firmer milestones on the approved up to 10 GW natural gas buildout approved earlier this year.
Signal: Infrastructure execution
Funding Clarity
Monitoring the impacts of the US$2.3bn equity sale and any potential Japanese funding progress.
Signal: Financing risk management
Sentiment Analysis · NextEra Energy
Interactive scenario analysis: $NEE
Select earnings outcome
Execution Focus
"Utility Renaissance" validates via execution signals
EPS above US$1.06 shifts attention to execution. Management points to signed large load agreements and clearer milestones for natural gas buildout. Progress converting 29.8 GW backlog into construction-ready projects strengthens sentiment significantly.
EPS Outcome
Above US$1.06
Infrastructure Signal
Contracts Signed
Likely Reaction
Sentiment Strengthens
Sources & Data Methodology
Sources: Reporting dates and release times are from company investor relations calendars where marked Confirmed; otherwise they are GO Markets estimates. Consensus EPS, revenue and analyst-range data are sourced from Bloomberg and Earnings Whispers, as at 13 April 2026 (AEST). Company guidance, backlog and operating metrics are sourced from the latest company filings or results presentations. Any scenario analysis reflects GO Markets analysis. Figures and schedules may change without notice.
From power to oil
If NextEra reflects the electricity side of the real economy story, Exxon Mobil reflects the fuel side. That matters in a market where supply risk can still reset inflation expectations, shift sector leadership and change how traders think about defensiveness.
$XOM| Q1 2026 REPORTING PERIOD
Exxon Mobil Corporation
NYSE | Energy | 29 Apr 2026
Estimated
Global Release Countdown (BMO)
00:00:00:00
Consensus EPS
US$1.66
Consensus Revenue
US$82.47bn
AUSTRALIA (AEST)29 Apr | 8:30 pm
ASIA (UTC+8)29 Apr | 6:30 pm
Market Intelligence: $XOM
Analysis: XOM price drivers and scenarios
Liquids Pricing Effect
+$1.9B - $2.3B
Positive 1Q realized price support
Energy Products Timing
-$3.3B to -$4.1B
Unfavourable 1Q accounting drag
Analyst Range
US$1.60 - 1.85
Low to high Q1 estimate spread
AVG
LOW US$1.60AVG US$1.66HIGH US$1.85
Exxon is the clearest oil-linked test in the market. The key issue is whether stronger oil and gas pricing can outweigh volume disruptions (6% production hit) and massive negative timing effects from Energy Products.
Trade Execution: $XOM
Earnings reaction framework: Q1 2026
Key signals to watch
Price Support vs Volume
Did the $2.3B pricing tailwind absorb the 6% Middle East production disruption?
Signal: Realized price strength
Timing Reversibility
Management commentary on whether the $4.1B timing drag is strictly non-cash and accounting-related.
Signal: Quality of earnings beat
Guyana Execution
Operational updates on the core upstream portfolio to ensure the long-term growth story remains constructive.
Signal: Upstream resilience
Sentiment Analysis · Exxon Mobil
Interactive scenario analysis: $XOM
Select earnings outcome
Price Support
Pricing tailwind more than absorbed the disruption
EPS above US$1.85 suggests high realized pricing from liquids absorbed volume hits. Management indicates timing effects were less severe than feared, with constructive operational updates from Guyana and the broader upstream portfolio.
EPS Outcome
Above US$1.85
Timing Impact
Smaller than feared
Likely Reaction
Sentiment Strengthens
Sources & Data Methodology
Sources: Reporting dates from company investor relations (Estimated for April 29, BMO). Consensus EPS and analyst-range data from Bloomberg and Earnings Whispers as at 13 April 2026 (AEDT). Scenario analysis reflects evaluateions of internal energy considerations. Figures and schedules are subject to change without notice.
Bottom line
This late-April energy cluster is about more than three company reports. It is a live test of what the market wants to pay for in 2026.
Tesla can show whether autonomy and energy are becoming more than a promise. NextEra can show whether rising electricity demand is turning into practical utility growth. Exxon can show whether oil strength still translates into durable earnings power.
Taken together, they offer a useful read on the part of the market that looks more physical, more capital-intensive and, for many traders, more real.
Your next earnings setup starts here
Stay ahead of major beats, misses, and market surprises. Log in to your terminal, open a new account, or explore our dedicated earnings academy.
O anúncio do cessar-fogo de 8 de abril e as discussões paralelas em torno de uma trégua de 45 dias não resolveram a interrupção do Estreito de Ormuz. Por enquanto, eles limitaram o pior cenário possível, mas o tráfego de petroleiros permanece em uma fração dos níveis normais e a demanda do Irã por taxas de trânsito sinaliza uma mudança estrutural, não temporária.
O que começou como um conflito regional se tornou um choque energético global, e a questão para os mercados não é mais se Ormuz foi interrompida, mas como a interrupção muda permanentemente o piso de preços do petróleo.
Principais conclusões
Cerca de 20 milhões de barris por dia (bpd) de petróleo e produtos petrolíferos normalmente passam pelo Estreito de Ormuz, entre o Irã e Omã, o equivalente a cerca de um quinto do consumo global de petróleo e cerca de 30% do comércio marítimo global de petróleo.
Isso é um choque de fluxo, não um problema de estoque. Os mercados de petróleo dependem do rendimento contínuo, não do armazenamento estático.
Se a interrupção persistir além de algumas semanas, o Brent poderá passar de um pico de curto prazo para um choque de preços mais amplo, com risco de estagflação.
O tráfego de petroleiros pelo estreito caiu de cerca de 135 navios por dia para menos de 15 no pico da interrupção, uma redução de aproximadamente 85%, com mais de 150 embarcações ancoradas, desviadas ou atrasadas.
Um cessar-fogo de duas semanas foi anunciado em 8 de abril, com negociações de trégua de 45 dias em andamento. O Irã sinalizou separadamente uma demanda por taxas de trânsito em embarcações que usam o estreito, o que, se formalizado, representaria um piso geopolítico permanente nos custos de energia.
Os mercados começaram a se afastar do crescimento e da exposição à tecnologia para nomes de energia e defesa, refletindo a visão de que o petróleo elevado está se tornando um custo estrutural em vez de um prêmio de risco temporário.
Institutional Grade Performance
Master the Markets with MetaTrader 5
Trade hundreds of instruments with superior speed and advanced technical analysis. Harness full EA functionality to execute your strategy.
O ponto de estrangulamento de petróleo mais crítico do mundo
O Estreito de Ormuz movimenta cerca de 20 milhões de barris por dia de petróleo e produtos petrolíferos, o equivalente a cerca de 20% do consumo global de petróleo e cerca de 30% do comércio marítimo global de petróleo. Com a demanda global de petróleo em torno de 104 milhões de bpd e a capacidade não utilizada limitada, o mercado já estava fortemente equilibrado antes da última escalada.
O estreito também é um corredor crítico para o gás natural liquefeito. Cerca de 290 milhões de metros cúbicos de GNL transitaram pela rota todos os dias, em média, em 2024, representando cerca de 20% do comércio global de GNL, com os mercados asiáticos como principal destino.
A Agência Internacional de Energia (IEA) descreveu Ormuz como o ponto de estrangulamento do trânsito de petróleo mais importante do mundo, observando que mesmo interrupções parciais podem desencadear grandes movimentos de preços. O petróleo Brent subiu acima de USD 100 o barril, refletindo tanto a rigidez física quanto o aumento do prêmio de risco geopolítico.
Fonte: Administração de Informações sobre Energia dos EUA, datada de 17 de junho de 2025, usando a média diária de 2024
Tanques ociosos enquanto os fluxos diminuem
Os dados de frete e seguro agora apontam para problemas em tempo real. Relata-se que mais de 85 grandes transportadores de petróleo bruto estão presos no Golfo Pérsico, enquanto mais de 150 navios foram ancorados, desviados ou atrasados à medida que os operadores reavaliam a segurança e a cobertura do seguro. Isso deixaria cerca de 120 milhões a 150 milhões de barris de petróleo bruto parados no mar.
Esses volumes representam apenas seis a sete dias de produção normal de Ormuz, ou pouco mais de um dia de consumo global de petróleo.
Os dados atualizados de transporte e seguro agora confirmam que mais de 150 embarcações foram ancoradas, desviadas ou atrasadas, acima das 85 relatadas inicialmente. Os 1,3 dias de cobertura do consumo global de petróleo bruto ocioso continuam sendo a restrição vinculativa: isso é um choque de fluxo, não um problema de armazenamento, e o cessar-fogo ainda não se traduziu em uma produtividade significativamente restaurada.
🌋 Trump, volatility and Hormuz.
As tariff shocks collide with a ten year extreme in oil positioning, the margin for error is zero. See the technical markers and safe haven pivots defining the current risk environment.
Os mercados de petróleo funcionam em movimento contínuo. Refinarias, plantas petroquímicas e cadeias de suprimentos globais são calibradas para entregas estáveis ao longo de rotas marítimas previsíveis. Quando os fluxos passam por um ponto de estrangulamento que carrega cerca de um quinto do consumo global de petróleo e cerca de 30% do comércio marítimo global de petróleo são interrompidos, o sistema pode passar do equilíbrio ao déficit em poucos dias.
A capacidade de produção não utilizada, amplamente concentrada na OPEP, é estimada em apenas 3 milhões a 5 milhões de bpd. Isso fica bem aquém dos volumes em risco se os fluxos de Ormuz forem severamente interrompidos.
GO Markets — Idle Tankers: Days of Cover
Oil market analysis
How long do idle tankers last?
135M idle barrels — days of cover against each demand benchmark
vs. Strait of Hormuz daily flow (20M bbl/day)
6.75 daysof Hormuz throughput covered
6.75 days
0
5
10
15
20
25
30 days
vs. Global oil consumption (104M bbl/day)
1.3 daysof world demand covered
1.3 days
0
5
10
15
20
25
30 days
vs. US Strategic Petroleum Reserve release (1M bbl/day)
135 daysof full SPR release pace covered
135 days — but SPR exists to replace this role
0
5
10
15
20
25
30 days
135M
idle barrels on tankers (midpoint of 120–150M range)
~33%
of daily Hormuz flow that is idle storage, not transit
<31 hrs
is all idle storage against global daily consumption
Indicative market trajectories based on disruption severity
Scenarios for the weeks ahead
1–2 WEEKS
Ceasefire catch-up
Markets face catch-up repricing. Brent could consolidate in the US$105–US$115 range as risk premia unwind. Brent may trade lower (US$95–US$110) if strategic stocks bridge the temporary shortfall.
2–4 WEEKS
Infrastructure blitz
Shifts to structural supply shock. Brent moving toward US$150–US$200 cannot be ruled out. This is the stagflation trigger where energy costs constrain central bank flexibility.
STRUCTURAL
Geopolitical floor
Iran's transit fee demand creates a permanent input cost. The pre-crisis price structure (US$60–US$70) may not return, embedded in insurance and freight rates.
Critical Threshold
US$120 remains the level at which energy inflation becomes a direct Federal Reserve policy problem.
Riscos de inflação e repercussões macro
O impacto inflacionário de um choque de petróleo normalmente chega em ondas. Preços mais altos de combustível e energia podem elevar a inflação global rapidamente, à medida que os custos de gasolina, diesel e energia aumentam.
Com o tempo, custos mais altos de energia podem passar por frete, alimentos, manufatura e serviços. Se a interrupção persistir, a combinação de inflação elevada e crescimento mais lento pode aumentar o risco de um ambiente estagflacionário e deixar os bancos centrais enfrentando uma difícil troca.
🛢️ Brent hits $100.
Exxon and SLB are leading the rotation out of tech. Get the price targets and technical support levels for the top 5 energy majors.
O que torna o episódio atual particularmente agudo é a falta de folga no sistema global.
A oferta e a demanda globais de cerca de 103 milhões a 104 milhões de bpd deixam pouca reserva quando um ponto de estrangulamento que movimenta quase 20 milhões de bpd, ou cerca de um quinto do consumo global de petróleo, é comprometido. A capacidade não utilizada estimada de 3 milhões a 5 milhões de bpd, principalmente dentro da OPEP, cobriria apenas uma fração dos volumes em risco.
Rotas alternativas, incluindo oleodutos que contornam Ormuz e reencaminhamentos marítimos, só podem compensar parcialmente os fluxos perdidos e, geralmente, com custos mais altos e prazos de entrega mais longos.
Conclusão
Até que o trânsito pelo Estreito de Ormuz seja restaurado e visto como confiavelmente seguro, é provável que os fluxos globais de petróleo permaneçam prejudicados e os prêmios de risco elevados. Para investidores, formuladores de políticas e tomadores de decisão corporativos, a questão central é se o petróleo pode se mover para onde precisa ir, todos os dias, sem interrupção.
Market Opportunity
Don't just watch the squeeze. Trade the framework.
As positioning gaps hit decade extremes, access advanced charting tools and real time execution on the six key markets defining this cycle.


.jpeg)

